Download
1 / 17
170 likes | 331 Views
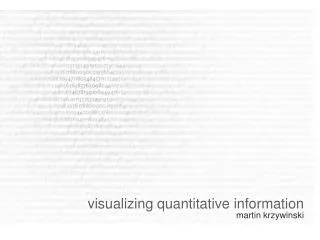
Visualizing Nutritional Information. Xinyi Chang. Have You Visualized Data Before?. Of course you have! . A More Realistic Example. Source: http:// www.tableausoftware.com /public/gallery/japan-quakes-1900. The Magic of Data Visualization!. See analytical results visually

E N D
Visualizing Nutritional Information Xinyi Chang
Have You Visualized Data Before? • Of course you have!
A More Realistic Example Source: http://www.tableausoftware.com/public/gallery/japan-quakes-1900
The Magic of Data Visualization! • See analytical results visually • Find relevance among variables • Communicate concepts or hypotheses to others Source: http://www.tableausoftware.com/public/gallery/japan-quakes-1900
Current Nutritional Labels Source: http://nutritionu.wordpress.com/2012/02/21/on-speed-reading-nutrition-labels/ Source: http://thetravelingtimes.wordpress.com/2012/03/15/gladly-ignoring-german-nutrition-labels/
Current Problems Consumer Complaint Problem with Label
A Mobile App to Solve the Problem • Wherefore art thou an app? • Educated shopping experience • Convenience • Interaction features • e.g. tapping
Current Technology • Competitive analysis
Highlights on Our Features • Personalization • Age, height, etc. • Nutrients of interest • Pure icon-based interface • Comparison mode (new!)
Next Step • Determine what could be used to help people perceive serving sizes better • Refine icons • How to handle corner cases? (e.g. 200% RDA) • Build the actual app!
Other Possible User Studies • How well do people associate nutrients with icons? • How well do people associate colors with specific nutrients? • Do people associate letters with nutrients?
Emotion Visualization? • Ever wondered what mood people are in? Click Me!