Download
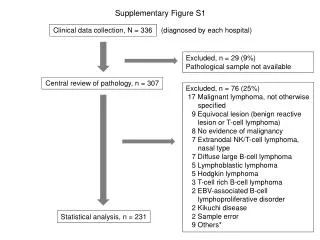
1 / 11
110 likes | 176 Views
Sul et al, Supplementary Figure S1. +. +. +. E1. 7. 8. 13. E2. parkin. +. +. +. Ub. +. +. +. +. +. +. FAF1. (kDa). 130. 96. 35 S-FAF1. 72.

E N D
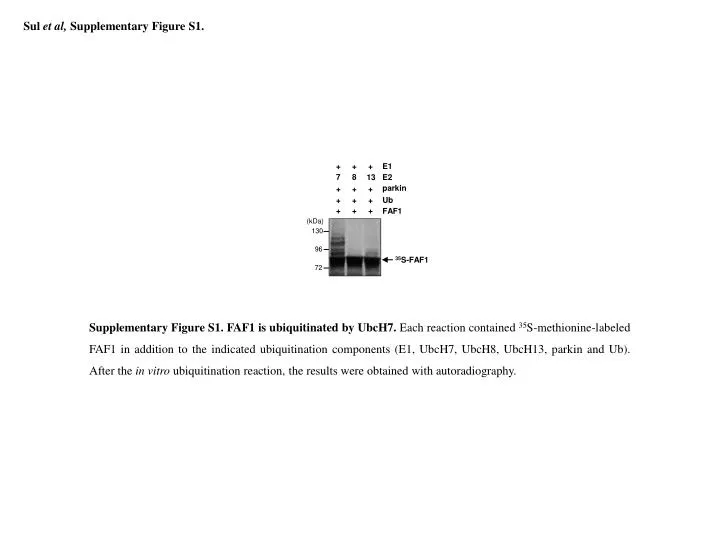
Sul et al, Supplementary Figure S1. + + + E1 7 8 13 E2 parkin + + + Ub + + + + + + FAF1 (kDa) 130 96 35S-FAF1 72 Supplementary Figure S1. FAF1 is ubiquitinated by UbcH7. Each reaction contained 35S-methionine-labeled FAF1 in addition to the indicated ubiquitination components (E1, UbcH7, UbcH8, UbcH13, parkin and Ub). After the in vitro ubiquitination reaction, the results were obtained with autoradiography.
Sul et al, Supplementary Figure S2. 2.0 1.5 Relative amount of FAF1 mRNA 1.0 0.5 0.0 FAF1 FAF1 + parkin WT FAF1 + parkin T240R Supplementary Figure S2. FAF1 mRNA expression is not decreased by parkin. Reverse transcription and real-time PCR analysis of FAF1 mRNA in transfected SH-SY5Y cells. The primers (forward, 5′-CTGCAGGA GTCATTAAATC-3′ and reverse, 5′-ATGGCAGGGATAAGAGAGCCC-3′). The data were calculated with respect to the abundance of the glyceraldehyde-3-phosphate dehydrogenase mRNA.
Sul et al, Supplementary Figure S3. 2.0 1.5 Relative amount of FAF1 mRNA 1.0 0.5 0.0 Parkin+/+ Parkin-/- Supplementary Figure S3. FAF1 mRNA expression is not increased in the ventral midbrain of Parkin-/- mice. Reverse transcription and real-time PCR analysis of FAF1 mRNA in the ventral midbrain of Parkin-/- and Parkin+/+ mice. The primers (forward, 5′-GGTGACTGCCATCCTGTATTTT-3′ and reverse, 5′-TGCTCTGTTG GTGTCCTTTG-3′). The data were calculated with respect to the abundance of the glyceraldehyde-3-phosphate dehydrogenase mRNA.
Sul et al, Supplementary Figure S4. R42P K161N WT T240R T415N G430D C431F P437L Myc-parkin - + + + + + + + + + HA-p38 WB: HA Myc β-actin Supplementary Figure S4. Degradation of p38 by parkin WT or mutants. SH-SY5Y cells were transfected with HA-p38 and Myc-parkin (WT and mutants), and cell lysates were analyzed by immunoblotting with an anti-HA antibody. The transfection efficiency was confirmed using an anti-Myc antibody, and an anti-β-actin antibody was used as a loading control.
Sul et al, Supplementary Figure S5. Flag-FAF1 WT Flag-FAF1 AA Flag-FAF1 DD MOCK WB: Myc-parkin - - + - + - + Flag Myc β-actin Supplementary Figure S5. Parkin accelerates the degradation of FAF1 independent of its phosphorylation status. SH-SY5Y cells were transfected with Myc-parkin and Flag-FAF1 (WT, AA or DD), and lysates were analyzed by immunoblotting with an anti-Flag antibody. Transfection efficiency was tested by immunoblotting with an anti-Myc antibody, and the equivalency of loading was confirmed using an anti-β-actin antibody.
Sul et al, Supplementary Figure S6. Myc-parkin Faf1+/+ Faf1gt/gt CCCP (h) WB: 0 3 6 12 24 36 0 3 6 12 24 36 FAF1 Myc Tom20 β-actin Supplementary Figure S6. FAF1 is not involved in mitophagy. Faf1+/+ and Faf1gt/gt MEFs were transfected with Myc-parkin, subjected to carbonyl cyanide m-chlorophenylhydrazone (CCCP, 25 μM) treatment for the indicated time periods, and total lysates were subjected to WB using specific anti-FAF1 and anti-Tom20 (Sigma) antibodies. The efficiency of transfection was confirmed using an anti-Myc antibody, and the loading equivalency was determined by immunoblotting with an anti-β-actin antibody.
Sul et al, Supplementary Figure S7. ** ** * 10 8 MPTP (20 mg/kg) Saline 3 d 5 d 7 d 6 Relative level of FAF1 WB: 1 2 3 1 2 3 1 2 3 1 2 3 4 FAF1 β-actin 2 0 Saline 3 d 5 d 7 d MPTP (20 mg/kg) Supplementary Figure S7. Expression of FAF1 was increased in a time-dependent manner in response to MPTP treatment. Lysates of the mouse ventral midbrain were prepared at indicated times after the last injection of MPTP to analyze the FAF1 level. Left panel, Western blot of FAF1. Right panel, densitometric analyses of band intensities normalized with respect to β-actin levels presented as mean ± SEM; **P < 0.01 and *P < 0.05.
Sul et al, Supplementary Figure S8. * * 14 Faf1+/+ 12 Faf1gt/gt 10 Relative amount of FAF1 mRNA 8 6 4 2 0 Exon 10 Exon 12 Supplementary Figure S8. FAF1 mRNA expression is reduced in Faf1gt/gt MEFs. Reverse transcription and real-time PCR analysis of FAF1 mRNA in immortalized Faf1+/+ or Faf1gt/gt MEFs. The primers (forward and reverse, respectively) were targeted to exon 10 (5′-CCTCTCTTATCCCTGCCATC-3′ and 5′-ACTTCTCCGTC ATCCACTCC-3′) or exon 12 (5′-GGTGACTGCCATCCTGTATTTT-3′ and 5′-TGCTCTGTTGGTGTCCTTTG -3′). The data were normalized with respect to the abundance of the glyceraldehyde-3-phosphate dehydrogenase mRNA. The results are expressed relative to the corresponding normalized values from Faf1+/+ MEFs, and they show the means ± SEM from three independent experiments; *P < 0.05.
Sul et al, Supplementary Figure S9. * Vehicle MPP+ 60 Parkin+/+ Parkin-/- scRNA siFAF1 scRNA siFAF1 40 LDH release (%) WB: parkin 20 FAF1 β-actin 0 scRNA siFAF1 siFAF1 scRNA Parkin+/+ Parkin-/- Supplementary Figure S9. Depletion of FAF1 protected Parkin-/- MEF cells from MPP+-induced death. Parkin+/+ and Parkin-/- MEFs were transfected with scRNA or siRNA targeting FAF1 (siFAF1, 5′-CCACCUUCAU CAUCUAGUC-3′) and subsequently treated with 5 mM MPP+ for 24 h. Left panel, death was determined by assessment of LDH release. Right panel, cell lysates were analyzed by immunoblotting with the indicated antibodies. Data are expressed as percentages of the control ± SEM; *P < 0.05.
Sul et al, Supplementary Figure S10. MPP+ (mM) WB: 0 1 3 5 FAF1 JNK P-JNK Casp-3 β-actin Supplementary Figure S10. JNK and caspase-3 activation is induced by MPP+ in SH-SY5Y cells. SH-SY5Y cells were treated with differentconcentrations of MPP+ for 24 h, and cell lysates were analyzed by WB using anti-FAF1, anti-JNK, anti-P-JNK, anti-Casp-3 and anti-β-actin antibodies.
Sul et al, Supplementary Figure S11. MOCK ** FAF1 20000 FAF1 + parkin WT FAF1 + parkin T240R 15000 DCF fluorescence (A.F.U.) 10000 5000 0 0 9 9 (h) NAC (50 μM) Supplementary Figure S11. Parkin significantly reduces FAF1-induced ROS generation. SH-SY5Y cells were MOCK transfected or transfected with Flag-FAF1 with or without co-transfection of Myc-parkin (WT or T240R). The cells were then subjected to MPP+ (5 mM) treatment for 9 h and then incubated with or without N-acetylcystein (NAC, Sigma), and the fluorescence intensity of DCF was measured (A.F.U., arbitrary fluorescence units). Data show the means ± SEM from three independent experiments; **P < 0.01.