Download
1 / 18
220 likes | 805 Views
Fuzzy Cognitive Maps E xercise. Prepared by Marta Olazabal and Johannes Flacke COST ACTION TU0902 Working Group 2- Adaptation, mitigation and climate change feedbacks in cities

E N D
FuzzyCognitiveMapsExercise Preparedby Marta Olazabal and Johannes Flacke COST ACTION TU0902 Working Group 2- Adaptation, mitigation and climate change feedbacks in cities Task 4. Development of influence diagrams to represent the propagation of feedbacks through urban systems and the ways in which these can be modified through adaptation and mitigation. 3rd-4th May 2012 CNR – National Research Council of Italy Piazzale Aldo Moro,7 - 00185, Roma, Italia
Summary of thetask Brief description: The aim of this task is to develop influence diagrams to represent the feedbacks that can be found among the elements of the urban system and the ways these feedbacks can be modified through actions of adaptation or mitigation of climate change. Method: Tool: FCM (Fuzzy Cognitive Mapping,http://www.fcmappers.net/ ) is used to map the perception of a complex problem of different participants, using their own maps to build a common bigger map (or influence diagram).
FCM Assignment:Fuzzy cognitive maps as a means to stronger link qualitative and quantitative aspects of scenario development Johannes Flacke (using material provided by Diana Reckien, PIK)
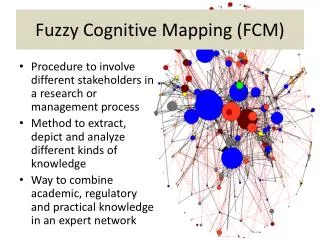
A fuzzy cognitive map for deforestation in the Brazilian Amazonas
What are fuzzy cognitive maps (FCM) • A form of cognitive maps showing relations among variables that were described people (stakeholders) not by researchers • Fuzzy = vague, qualitative, incomplete knowledge • FCM consist of nodes (concepts, variables) with connections (edges) between them that represent the causal relationship between the concepts • Each connection gets a weight (0-1) according to the strength of the causal relationship (pos./neg.) • FCM have a graphical and a mathematical representation
Example of a FCM session with stakeholders (From PIK Potsdam)
How to develop FCM Three steps: • Define which concepts are important (individual) (next slide, left side) • Define which relation exists (individual) (next slide, right side) • Define sign and strength of relationships (plus/minus, 0-1) (individual, small group) (next slide, right side) • Put all the individual maps together (Happening in Rome)
Example of a FCM session with stakeholders (From PIK Potsdam)
Question to be mapped In your city, “What do you expect to happen due to peak oil and the increase in petrol prices that we are experiencing just now?”
Question Context: The effects of this upcoming event in the short and medium term are going to be really serious in cities and they have to be taken into account in adaptation and mitigation plans. Spain, for example, has suffered an 18% increase in the oil price during the first 3 months of 2012. The increase in energy prices is affecting local economy, transport and lifestyles in a way that further adaptation and mitigation measures will have to be implemented. In the case of Bilbao, we have a strong dependence on fossil fuels (98% of the total consumption) and a very specific geographic and environmental conditions which requires long term planning.
Whatispeakoil? The International Energy Agency released in its World Energy Outlook 2010, for the first time that the global crude oil production peak was reached in 2006. International demand has since fallen slightly thanks to global economic crisis, but once economies around the world have recovered, the IEA says daily crude production alone will no longer be sufficient to meet their needs.
Whatispeakoil? Whatdoesit mean at worldwidelevel? Goldenstage of gas? Renewableenergies Demand for all fuels rises, but the share of fossil fuels in global primary energy consumption falls slightly from 81% in 2010 to 75% in 2035; natural gas is the only fossil fuel to increase its share in the global mix over the period to 2035. In the power sector, renewable energy technologies, led by hydropower and wind, account for half of the new capacity installed to meet growing demand. ClimateImpacts(e.g.temperaturerise) onenergytrends AND energyconsumptionimpactsonclimate “Four-fifths of the total energy-related CO2 emissions permissible by 2035 in the 450 Scenario are already “locked-in” by our existing capital stock (power plants, buildings, factories, etc.).” WEO 2011 “The most important contribution to reaching energy security and climate goals comes from the energy that we do not consume.” WEO 2011 End of cheapoil - impactsontransport
In your city, “What do you expect to happen due to peak oil and the increase in petrol prices that we are experiencing just now?” • Write down everything that comes to your mind (factors/concepts) in relation to peak oil in your city. • Make a net out of this list: • Place the most important in the middle of a sheet of paper, connect it with other factors that you wrote down, them with arrows, interlink them • Consider how one concept influences the other, positively (+) or negatively (-), add this to the arrows • Weight the connections (!): estimate the strength of the influence from one concept onto the other in a range of any real number between -1 to 1 • the different numbers don’t need to sum up to 1 • but the extent of an influence should be comparable within one map
Output Influence diagram could be used as a screening tool… To be used by city technicians to have an overall idea on the feedbacks and loops that decisions regarding urban planning and design can bring into the city in the short, medium or long term. To identify critical impact areas To anticipate unintended impacts. Toforecast, learn and act.