Download
1 / 13
130 likes | 261 Views
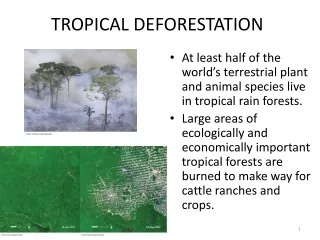
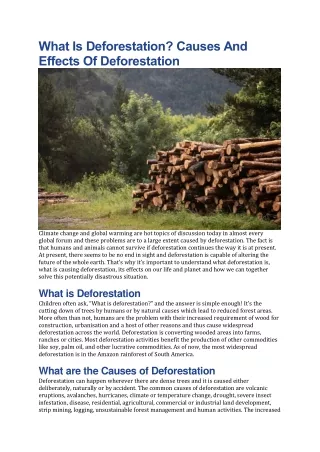
Effects of Tropical Deforestation on Tropospheric Chemistry: A 10-year Study using GEOS-Chem Prasad Kasibhatla, Duke University James Randerson and Yang Chen, University of California Irvine Guido van der Werf, Vrije University Louis Giglio, Science Systems and Applications, Inc.

E N D
Effects of Tropical Deforestation on Tropospheric Chemistry: A 10-year Study using GEOS-Chem Prasad Kasibhatla, Duke University James Randerson and Yang Chen, University of California Irvine Guido van der Werf, Vrije University Louis Giglio, Science Systems and Applications, Inc. Jim Collatz, NASA Goddard Space Flight Center Ruth DeFries, Columbia University Doug Morton, University of Maryland 4th GEOS-Chem Users’ Meeting April 9, 2009
Global C Budget for 1990s black – steady-state preindustrial red – anthropogenic perturbation +3.2 Gt C/yr Source: IPCC AR4 WG1 Report • LUC 0.5-2.7 Gt C/yr (large uncertainty) - primarily tropical deforestation • model vs satellite measurements of CO in regions of intense deforestation • model simulations with and without fire emissions in deforestation regions
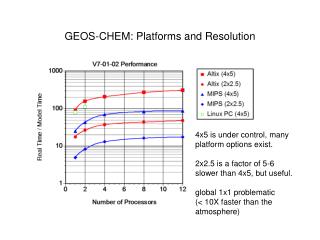
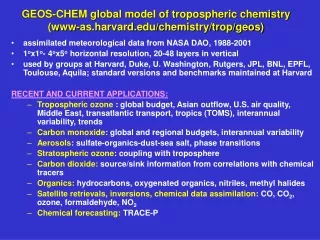
Model Simulations Model • GEOS-CHEM v8-01-02 driven by GEOS-4 4x5 met fields Emissions • Fossil fuel combustion: EDGAR with regional inventories for North America (NEI), Europe (EMEP), Asia (Streets), and Mexico(BRAVO) - representative of year ~2000 • Biofuel combustion: Yevich and Logan • Biogenic VOCs: MEGAN • Biomass burning: Annually-varying, monthly GFED2 emissions Runs • Run 1: 1997-2007 full chemistry simulation (2005 met fields for 2007) • Run 2:1997-2007 tagged CO simulation using monthly-mean • OH fields from Run 1 • Run 3: 1997-2007 full chemistry simulation without biomass burning • emissions in grid cells with detected humid tropical forest • deforestation between 2000-2005 (Hansen et al., PNAS, 2008)
Tagged CO Biomass Burning Regions BOAS-east EURO BOAS-west BONA CEAS TENA SEAS CEAM EQAS NHSA SHSA AUST NHAF SHAF MIDE • For this talk, focus on • SHSA • Total fire emissions = 314 Tg C/yr; deforest. fire emissions = 209 Tg C/yr • EQAS Total fire emissions = 255 Tg C/yr; deforest. fire emissions = 255 Tg C/yr (Global fire emissions = 2415 Tg C/yr; deforest. fire emissions = 813 Tg C/yr)
MOPITT Model Total In-region fires Out-of-region fires Fossil fuel/biofuel Methane oxidation Biogenic HC oxidation Model vs MOPITT Regional Average CO over EQAS 700 mb CO CO (ppb) year • Large interannual variability – generally well simulated by model
MOPITT Model Total In-region fires Out-of-region fires Fossil fuel/biofuel Methane oxidation Biogenic HC oxidation Model vs MOPITT Regional Average CO over SHSA 700 mb CO CO (ppb) year • Seasonal fire season peak reasonably well simulated, but • but modeled interannual variability is higher than observed • Significant overestimate in non-fire season suggesting • biogenic hydrocarbon oxidation source of CO is too high
700 mb CO (ppb): Model vs MOPITT Model - MOPITT MOPITT Model JUL AUG SEP OCT 2005
September Surface O3 (ppb): With – Without Deforestation SEP 1997 SEP 2000 SEP 2005 SEP 2006
September Surface PM2.5 (µg m-3): With – Without Deforestation SEP 1997 SEP 2000 SEP 2005 SEP 2006
Annual N Deposition: With/Without Deforestation 1997 2000 2005 2006
October 1997 OH % Change: 100*(With – Without Def.)/(With Def) Surface 500 mb 300 mb 700 mb
Summary • Variability of regional average modeled CO in general agreement with MOPITT CO over EQAS and SHSA lends confidence to GFED2 C emissions from tropical deforestation since these are major deforestation regions, BUT interannual variations over SHSA seems to be overestimated. • and MORE IMPORTANTLY, poor simulations of spatial patterns over SHSA. • GFED2 2000-2005 pan-tropical deforestation fire C emissions ~0.8 P C yr-1 • best estimate of committed C flux ~ 0.8-1.3 Pg C yr-1 • Significant effect of tropical deforestation on local/regional air quality • parameters next steps will involve analysis of human health/ecological effects (Miriam Marlier), in concert with next generation of GFED product • and regional atmospheric chemistry modeling over SHSA and EQAS.
Acknowledgements • NASA (funding) • Bob Yantosca, Philippe Le Sager, Claire Carouge (model) • Louisa Emmons, Merritt Deeter, and MOPITT team (MOPITT data) • Jennifer Logan (discussions) • Jesse Kenyon (programmer)