Download
1 / 14
140 likes | 252 Views
Dive into the inner workings of hard disks, factors affecting latency and bandwidth, parallel I/O, RAID systems, and performance tuning for faster programs. Learn about data collection tools for code optimization.

E N D
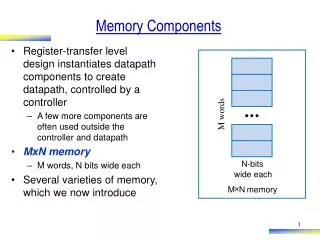
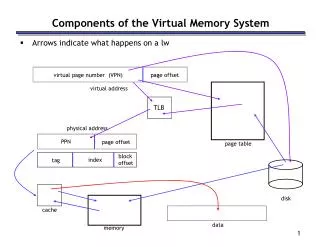
virtual page number (VPN) page offset virtual address TLB physical address page offset page table block offset index tag disk cache data memory Components of the Virtual Memory System • Arrows indicate what happens on a lw PPN
Hard drives • The textbook shows the ugly guts of a hard disk • Data is stored on double-sided magnetic disks called platters • Each platter is arranged like a record, with many concentric tracks • Tracks are further divided into individual sectors, which are the basic unit of data transfer • Each surface has a read/write head like the arm on a record player, but all the heads are connected and move together • A 75GB IBM Deskstar has roughly: • 5 platters (10 surfaces), • 27,000 tracks per surface, • 512 bytes per sector, • ~512 sectors per track… …but this number increases going from the center to the rim
I/O Performance • There are two fundamental performance metrics for I/O systems: • Latency Time to initiate data-transfer (units = sec) • Bandwidth Rate of initiated data-transfer (units = bytes/sec) Time = latency + transfer_size / bandwidth secbytes / (bytes/sec) Dominant term for small transfers Dominant term for large transfers
Accessing data on a hard disk • Factors affecting latency: • Seek time measures the delay for the disk head to reach the track • A rotational delay accounts for the time to get to the right sector • Factors affecting bandwidth: • Usually the disk can read/write as fast as it can spin • Bandwidth is determined by the rotational speed, which also determines the rotational delay • We can compute average seek time/rotational delay/etc. but careful placement of data on the disk can speed things up considerably: • head is already on or near the desired track • data in contiguous sectors • in other words, locality! • Even so, loading a page from the hard-disk can take tens of milliseconds
Parallel I/O • Many hardware systems use parallelism for increased speed • A redundant array of inexpensive disks or RAID system allows access to several hard drives at once, for increased bandwidth • similar to interleaved memories from last week
CS232 roadmap Here is what we have covered so far Understanding the relationship between HLL and assembly code Processor design, pipelining, and performance Memory systems, caches, virtual memory, I/O The next major topic is: performance tuning How can I, as a programmer, make my programs run fast? First step: where/why is my program slow? Program profiling How does one go about optimizing a program? Use better algorithms/data structures Exploit the processor better (after Midterm 3)
Performance Optimization Flowchart “We should forget about small efficiencies, say about 97% of the time.” -- Sir Tony Hoare 7
Collecting data The process is called “instrumenting the code” One option is to do this by hand: record entry and exit times for suspected “hot” blocks of code but this is tedious and error prone Fortunately, there are tools to do this instrumenting for us: Gprof: The GNU profiler (run g++ with the -pg flag) g++ keeps track of source code object code correspondence also links in a profiling signal handler the program requests OS to periodically send it signals signal handler records instruction that was executing (gmon.out) Display results: gprof a.out Shows how much time is being spent in each function Shows the path of function calls to the hot spot 8
Collecting data (cont.) • gprof doesn’t say where inside the function the time is spent • in a big function, this is still a needle in a haystack • gcov: the GNU coverage tool • Compile/link as g++ mp6.cxx -fprofile-arcs -ftest-coverage • records frequency of each line (like –prof_file in spim) • Run as normal (creates mp6.gcda and mp6.gcno) • Run gcov mp6.cxx and then open mp6.cxx.gcov
Performance Optimization, cont. How do we fix performance problems?
Original code (135 vertices) • valgrind --tool=cachegrind a.out • I refs: 46,049,383 I1 misses: 1,147 L2i misses: 1,128 I1 miss rate: 0.00% L2i miss rate: 0.00% • D refs: 27,788,106 (24,723,408 rd + 3,064,698 wr) D1 misses: 869,707 ( 862,893 rd + 6,814 wr) L2d misses: 11,175 ( 4,804 rd + 6,371 wr) D1 miss rate: 3.1% ( 3.4% + 0.2% ) L2d miss rate: 0.0% ( 0.0% + 0.2% ) • L2 refs: 870,854 ( 864,040 rd + 6,814 wr) L2 misses: 12,303 ( 5,932 rd + 6,371 wr) L2 miss rate: 0.0% ( 0.0% + 0.2% ) 19.267u 0.023s 0:19.45 99.1%
Original code (O2 compiler flag) • I refs: 17,354,974 I1 misses: 1,138 L2i misses: 1,119 I1 miss rate: 0.00% L2i miss rate: 0.00% • D refs: 7,376,517 (6,835,268 rd + 541,249 wr) D1 misses: 868,703 ( 861,894 rd + 6,809 wr) L2d misses: 11,176 ( 4,805 rd + 6,371 wr) D1 miss rate: 11.7% ( 12.6% + 1.2% ) L2d miss rate: 0.1% ( 0.0% + 1.1% ) • L2 refs: 869,841 ( 863,032 rd + 6,809 wr) L2 misses: 12,295 ( 5,924 rd + 6,371 wr) L2 miss rate: 0.0% ( 0.0% + 1.1% ) 18.937u 0.027s 0:19.15 98.9%
Better cache usage • I refs: 19,827,127 I1 misses: 1,148 L2i misses: 1,130 I1 miss rate: 0.00% L2i miss rate: 0.00% • D refs: 6,281,750 (5,710,369 rd + 571,381 wr) D1 misses: 199,355 ( 191,241 rd + 8,114 wr) L2d misses: 12,480 ( 4,805 rd + 7,675 wr) D1 miss rate: 3.1% ( 3.3% + 1.4% ) L2d miss rate: 0.1% ( 0.0% + 1.3% ) • L2 refs: 200,503 ( 192,389 rd + 8,114 wr) L2 misses: 13,610 ( 5,935 rd + 7,675 wr) L2 miss rate: 0.0% ( 0.0% + 1.3% ) 1.146u 0.027s 0:01.20 96.6%
Manual Optimizations • I refs: 16,347,210 I1 misses: 1,148 L2i misses: 1,130 I1 miss rate: 0.00% L2i miss rate: 0.00% • D refs: 5,105,818 (4,559,900 rd + 545,918 wr) D1 misses: 198,821 ( 190,840 rd + 7,981 wr) L2d misses: 12,479 ( 4,804 rd + 7,675 wr) D1 miss rate: 3.8% ( 4.1% + 1.4% ) L2d miss rate: 0.2% ( 0.1% + 1.4% ) • L2 refs: 199,969 ( 191,988 rd + 7,981 wr) L2 misses: 13,609 ( 5,934 rd + 7,675 wr) L2 miss rate: 0.0% ( 0.0% + 1.4% ) 0.457u 0.025s 0:00.49 95.9%