Download
1 / 12
120 likes | 215 Views
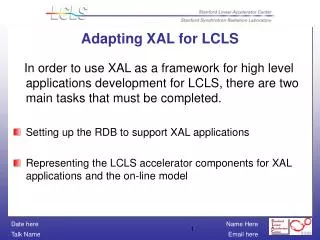
Loss Viewer 2 - XAL application. Alexander Zhukov SNS. BLMs at SNS. How we use BLMs Prevent instant loss high power Limit activation Tune the machine Measure residual activation during down time Measure “intentional loss”. Total number > 360!.

E N D
Loss Viewer 2 - XAL application Alexander Zhukov SNS
BLMs at SNS • How we use BLMs • Prevent instant loss high power • Limit activation • Tune the machine • Measure residual activation during down time • Measure “intentional loss” Total number > 360! BLM system is a crucial part of MPS – the last line of defense against uncontrolled beam loss Presentation_name
What are operator/physicist requirements? • Overall bar-plot view of the whole machine • BLM must be labeled on bar-plotwith its name (not some number) • MPS Limits • Different normalizations (over beam charge, limit etc) • Export losses to a file • IOC software is hard to change due to formal administrative procedures • History in some form Presentation_name
LossViewer2 application • Client side - no IOC modifications • XAL application shares common LAF with other apps • Standard XAL optics file • Configurable detector sets (D’nD) • JFreechart for plotting • Axis dedicated to detector type • Show/hide button for limits Presentation_name Default view of the whole machine. Red bars are showing limits, blue bars ICs and green ones NDs. The label color reflects detector status (e.g. yellow means signal is lower than noise level). This is the main application to keep eye on losses in SNS Control Room.
Table pane and Drag’n’Drop Plot pane Table pane for selection and details Presentation_name
Dynamic table view Presentation_name
Normalizations • Normalizations can be reasonably combined (e.g. charge and distance) • User can select to use rolling average instead of signal itself Presentation_name
Weighed history Presentation_name
Waterfall plot Custom widget not Jfreechart Presentation_name
MPS limits for RTBT Limit selection startegy Presentation_name
BLM statistics • XAL service collects data into ORACLE • Web application loads it and generates report • Constant time for generating report regardless time period covered by report less than 15 seconds • Data available since Jan 2007 • Time resolution one minute • History plot available as well Presentation_name
Summary • LossViewer2 is an XAL application that displays losses in different forms • Good example of using XAL framework • Currently it is one of the most used applications in Control Room • Satisfies (more or less) both physicists and operators Presentation_name