Download
1 / 21
210 likes | 346 Views
Combining EMME/2 and ArcView GIS: The CAPITAL Model Case Study. EMME/2 10th European User Conference. Introductions. Richard Hopkins Transport for London (TfL) Nigel Robbins Brown & Root David James Brown & Root. CAPITAL Presentation Overview. Purpose of Presentation

E N D
Combining EMME/2 and ArcView GIS: The CAPITAL Model Case Study EMME/2 10th European User Conference
Introductions Richard HopkinsTransport for London (TfL) Nigel Robbins Brown & Root David James Brown & Root
CAPITAL Presentation Overview • Purpose of Presentation • What is CAPITAL? • Software/Applications • The Calculator • Overview • Key Components • Stages of the Calculator • Examples of output
Purpose of presentation • What is CAPITAL? • What is Railplan? • The EMME/2 and GIS approach
definition What is CAPITAL? Calculator (for measuring) Public Transport Accessibility in London
What is CAPITAL? • To provide a planning tool for calculating detailed and accurate measures of real ‘clock’ travel time accessibility, from an area, to a specific location (or the reverse movement). e.g. • Town centres • Development sites • Hospitals • Supermarkets
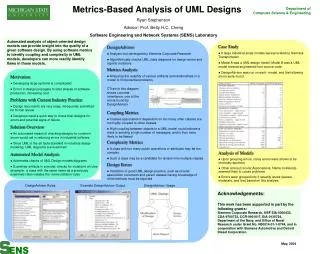
Software Overview • Emme/2 - Railplan • ArcView GIS • Network Analyst Reporting Customised Interface ArcView 3.2 ( + Network Analyst ) GIS CAPITAL Model Database tables Queries TfL Spatial Layers and Base mapping layers Data transferred into emme/2 (via macros) Data transferred into GIS (via ASCII files)
Railplan PT model • EMME/2 software • Strategic ‘PT Network/Assignment’ model • Stations, TOC, LUL, DLR, Bus services/network • Amended zoning structure
Extent of Railplan PT model Area of Interest for Demo: Parliament Square
OSCAR network Railplan Zones # # # Railplan nodes # # Railplan network # # # # # # # # # # Area of Interest for Demo: Parliament Square
CAPITAL:The concept PT access 1 (Bus Stop) 3 mins 10 mins 20 mins ED Origin(s) Centroid PT access 2 (LUL Station) ED Destination(s) Centroid 7 mins 6 mins 10 mins PT access 3 (TOC Rail Station) 10 mins 4 mins 5 mins Walk Access Time via OSCAR network (GIS) PT Travel Time via Railplan network (emme/2) Walk Egress Time via OSCAR network (GIS)
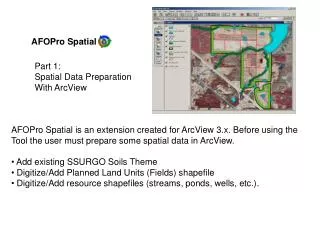
OSCAR network • ED boundary • ED Centroid • Railplan zone • Railplan network • Railplan nodes • Railplan nodes • (Selected within buffer) • Buffer Area • Min.Cost route(s) Example of Origin and Destination selection
OSCAR network • ED boundary • ED Centroid • Railplan zone • Railplan network • Railplan nodes • Railplan nodes • (Selected within buffer) • Buffer Area • Min.Cost route(s) Railplan zone and Census ED boundaries
OSCAR network • ED boundary • ED Centroid • Railplan zone • Railplan network • Railplan nodes • Railplan nodes • (Selected within buffer) • Buffer Area • Min.Cost route(s) Railplan zone and Census ED boundaries (+ OSCAR links)
How does CAPITAL link the walk and PT networks? • Bus and Light Rail Stops • Station Entrances • PT access/ egress points are the key link between GIS andRailplan • SAP - Service Access Point • SEP - Service Egress Point
OSCAR network • ED boundary • ED Centroid • Railplan zone • Railplan network • Railplan nodes • Railplan nodes • (Selected within buffer) • Buffer Area • Min.Cost route(s) Least Cost Path through Walk Network
Demonstration • Simple ‘Windows-style’ interface • Menus linked to CAPITAL processes • Management of the Railplan scenarios • Show how SAPs/SEPs imported into the GIS • Create a walk file • Specifying a CAPITAL ‘run’ linking with Emme/2 • Results shown in GIS
Achievements • Improved performance • Improved network modelling capability • Modelling of Walk access and egress with improved algorithm for egress • Multiple destinations • Choice of access/egress mode speeds • File management structure based on projects
Next steps..?? • Tools to display route choice • Multi-modal networks (cycle, car etc) • Improved management of SAPs/SEPs via Emme/2, including node specific penalties • extend access modes (e.g. cycle, car etc) • integrate CAPITAL the Planning Information Database for TfL. • Modelling of mobility impaired access/journeys