Download
1 / 22
220 likes | 399 Views
Visual Data Mining SC4Devo – July 15 th 2004. Mihael Ankerst Boeing Phantom Works. Data Mining Algorithms + + - -. Visualization - - + +. Actionable Evaluation Flexibility User Interaction. Visual Data Mining. Data Mining. Information Visualization.

E N D
Visual Data Mining SC4Devo – July 15th 2004 Mihael Ankerst Boeing Phantom Works
Data Mining Algorithms + + - - Visualization - - + + Actionable Evaluation Flexibility User Interaction Visual Data Mining Data Mining Information Visualization Visual Data Mining
Data Data DM-Algorithm step 1 Visualization of DM-Algorithm the result DM-Algorithm step n Visualization + Interaction Result Result Visualization of the result Knowledge Knowledge Visual Data Mining Architecture: Tightly Integrated Visualization Data Visualization of the data DM-Algorithm Result Knowledge Subsequent Visualization (SV) Tightly integrated Visualization (TIV) Preceding Visualization (PV)
One example forPreceding Visualization Circle Segments Visualization of Stock Data • Exploring ~10,000 records 50 different stock prices
Two examples forSubsequent Visualization • Decision Tree Visualizer (MineSet) • SPSS AnswerTree
Tightly Integrated Visualization • Visualization of algorithmic decisions • Data and patterns are better understood • User can make decisions based on perception • User can make decisions based on domain knowledge • Visualization of result enables user specified feedback for next algorithmic run Data DM-Algorithm step 1 DM-Algorithm step n Visualization + Interaction Result Knowledge Tightly integrated Visualization (TIV)
The first prototypes which follow this architecture: Perception-Based Classification (Decision Tree Classification) HD-Eye (Clustering) DataJewel (Temporal Mining) Tightly Integrated Visualization
The corresponding DM Method • Classification Problem description: Given a set of objects with known class labels. • Description Build model describing the data with respect to the class • Prediction Use model to predict the class label of objects Age a a a a b a b a b b b b Height
Age Salary Sex Class age < 35 25 15 M Y 42 40 M N 29 63 F Y Y 81 45 F N sal < 67 57 89 M Y Y N Tree Model Tutorial Problem description: Given data describing individuals, find factors that indicate buyers. • Algorithm Search through all factors to find one which best divides people into buyers / not buyers Divide groups and repeat on subgroups • Outcome Tree uses factors to describe people who are likely to be buyers
age < 35 Y sal < 67 Y N Tutorial (2) Extracting Rules from a Decision Tree IF (age < 35) THEN Class = ‘Yes’ IF (age >= 35) AND (sal < 67) THEN Class = ‘No’ IF (age >= 35) AND (sal >= 67) THEN Class = ‘Yes’
Visual Classification ... • Each attribute is sorted and visualized separately • Each attribute value is mapped onto a unique pixel • The color of a pixel is determined by the class label of the object • The order is reflected by the arrangement of the pixels
Pixel Arrangement Attribute 1 Attribute 2 ... PBC Color Scale ... An Example: n-ary split Attribute 1 Attribute 2 binary split Visual Classification
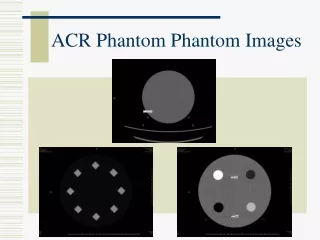
Visual Classification • Shuttle data set (9 attributes, 43,500 records)
Visual Classification • Segment data set (19 attributes, 7 classes)
age < 35 Visual Classification • A New Visualization of a Decision Tree
age < 35 G Salary < 40 > 80 [40,80] Visual Classification • A New Visualization of a Decision Tree
age < 35 G Salary < 40 > 80 [40,80] P V G Visual Classification • A New Visualization of a Decision Tree
Visual Classification • A Decision Tree for the Segment Data Set Level 1 Level 2 ... leaf split point inherited split point Level 18
Visual Classification Different types of algorithmic support for the user: • Propose split • Look-ahead • Expand subtree
Visual Classification animated split lines magnified split lines exact split point
Visual Classification Accuracy:
Conclusions • Tight integration of visualization and data mining algorithms is still a very new area of research • Data mining algorithms and visualization technique can nicely complement each other. • PBC leverages decision tree algorithms, allows the user to steer the mining process. • User involvement during the mining process enables knowledge transfer and capitalizes on human’s perception