Download
1 / 48
500 likes | 533 Views
MSc GIS: GIS Algorithms and Data Structures. Cartographic Principles: Map design. Martin Dodge (m.dodge@ucl.ac.uk) Lecture 3, Wednesday 15th December 2004 http://www.casa.ucl.ac.uk/martin/msc_gis/. What my lectures will cover. Visualising Geographic Information (last week)

E N D
MSc GIS: GIS Algorithms and Data Structures Cartographic Principles:Map design Martin Dodge (m.dodge@ucl.ac.uk) Lecture 3, Wednesday 15th December 2004 http://www.casa.ucl.ac.uk/martin/msc_gis/
What my lectures will cover • Visualising Geographic Information (last week) • 10.00 - 11: What is visualisation? • break • 11.15 - 12.15: Cartographic visualisation • Cartographic Principles (this week) • 10.00 - 11.00ish: Map design • break • 11.15 - 12.15: Information visualisation
Map saturated world • more maps are available than at any time in history • finding the right map can still be hard • distribution of map coverage is uneven • sources of hardcopy maps. don’t forget map libraries - UCL Geography, University of London Library in Senate House, British Library • Royal Geographical Society • Stanfords map shop, Long Acre, Covent Garden, www.stanfords.co.uk • Oddens map list, http://oddens.geog.uu.nl/
Graphicacy • literacy, numeracy and articulacy • argued in ‘modern’ world of screens and interfaces, that graphicacy is becoming more important • understanding maps need graphicacy • graphicacy skills of map-makers and map-users • said to be inherent skill, but some are better than others. artistic flair, designer eye for form and layout • everyone is potentially a map-maker. can’t rely on the skills of professional cartographers
How maps work? • abstractions to make a ‘scale model of reality’ • c.f. famous fictional stories of the 1:1 maps selection • 1. classification (grouping similar features) to reduce complexity and organise information • 2. simplification • 3. symbolization • these are design processes (and are inherently subjective) • there is no one true map of a phenomena or place
A lot of this design process is actually surprisingly hard to automate to software algorithms • but computer cartography is really useful in that you can explore many possible design options • how this can also be a huge time sink as you try out every combination of fonts, sizes and colours!
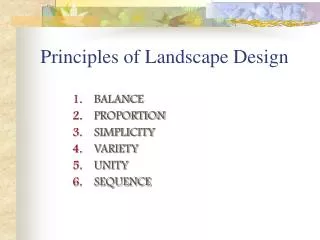
Design • there are some (scientific) rules in map design • but much artistic judgement in terms of • selection of colours • symbology • labelling (format and position) • arrangement of overall layout • (plus data selection, projection, scale, etc) • subtle changes in design (e.g. weight of a label font for particular objects) can yield big changes in how the map is read • use (and mis-use) the power of design. ethical practices not to deliberately deceive
Design and ‘dangers of defaults’ • modern gis, mapping, drawing, DTP software is very flexible and powerful • but still constrains design • always question software defaults settings
Tufte’s principles of graphical excellence • show the data • induce the reader to think about the substance rather than the methodology, graphic design, gee-whiz technology • avoid distorting what the data have to say • present many numbers in a small space • make large datasets coherent • encourage the eye to compare different pieces of data
Tufte’s principles of graphical excellence • reveal the data at several levels of detail, from broad overview to the fine structure • serve a reasonably clear purpose: description, exploration, tabulation or decoration • be closely integrated with the statistical and verbal descriptions of a dataset
Try to cover the following • assumption of maps made for presentation, they need to be usable for general audience • map layout • map scale and generalisation • symbolisation and graphic variables • choropleth mapping & data classification • colour • labelling and typography
Map layout • for presentation maps, some conventions on what to include: • a title (or caption). clearly state what the map shows. plus relevant date of data, sources, missing values, author, contact info, etc • a legend, so any reader can interpret the content of the map. meaning of all symbol and colours • scale indication. translates distance on the map to distance on the ground • orientation indication (the good old north arrow) • borders and neatlines • these conventions are widely broken!
Balance and centre • Visual impact of arrangement. harmonious arrangement around the optical centre • concern for weight and direction of objects around the ‘natural’ centre • unbalanced composition look random and accidental optical centre geometric centre
Golden proportions 1 1.618
Map scale • what level of detail is shown • crucial to choose appropriate scale to work at • large scale map : small surface area in high detail (e.g. city plans) • small scale : large surface area in low detail (e.g. national road atlas) • scale represented as a statement (“one inch equals five miles”), a graphical scale bar, (useful for measuring lengths), or as a representative fraction (1:1250) • very few maps use scale consistently for every object
Key modes of generalisation • distortion is inherent, • inevitable, unavoidable • may have to leave • features off the map • altogether • avoid visual clutter, • balance content and • legibility
Map symbolisation • graphic language (of points, lines, polygon, icons and text) used to represent ‘real’ features on the map • legibility (‘practical’) • harmonious (‘pretty’) • symbols can be iconic, geometric or abstract • symbol selection is creative aspect of design, wide choice and few firm rules • symbols can have several different dimensions (properties or characteristics) which encode meaning • symbols can have quantitative or qualitative meaning
Graphic variables for symbols • shape, size, orientation • colour hue, colour value, colour saturation, pattern • and location of course
(Source: Larry Landweber, http://www.cs.wisc.edu/~lhl/maps/)
Choropleth maps • counterpart of histogram • aggregate data, usually ratio or percentage • data map for discrete spatial units • choro from choros (place) and pleth (value) • practical Issues • choice of intervals - number and their breaks • equal interval, equal share (quantiles), standard deviational, … • choice of colors • important for perception of patterns • misleading role of area of spatial units • larger areas “seem” more important
very widely used. the ‘default’ mapping, especially for social data (e.g. census) • most mapping tools produce choropleth maps • easy produced in GIS, stats software • not necessarily the best solution • problems. can easily promote false notions of homogeneity inside the zones and sharp cut-off at the borders. real phenomena (e.g. Internet access) do not fit neat set of units • should be used for ratio data and not absolute counts as most spatial units are variable in size
Data classification • classification is a key method of abstracting reality into simplified map • method of classification is important as effects ‘look’ of the map • classification scheme can easily be experimented with (manipulated?) to give the pattern you want • classification should ‘match’ data distribution • number of classes. can reader interpret between them? recommended max of 6 • distribution of zones into classes
should aim for simplicity in classification • should cover the full data range • no overlap between classes • should be fully detailed in the legend • make sure the legend and classification actually match
Same data plus different classification equal different looking choropleth map!
Classification options from ArcMap • natural breaks (Jenks method), • quantiles, • equal interval, • standard deviation • See handout from Dent (1999, page 145)
Technical reading • Evans, (1977) “The selection of class intervals”, Transactions of the Institute of British Geographers, 53, pp. 98-124. (available from JSTOR) • Jenks and Caspall, (1971) “Error on choropleth maps: Definition, measurement and reduction”, Annals of the Association of American Geographers, 61, pp. 217-244. (available from JSTOR) • Miller (1956) “The magical number seven plus, or minus two: some limits on our capacity for processing information” The Psychological Review, 63, pp. 81-97. (www.well.com/user/smalin/miller.html)
The role of colour • colour is one of most exciting aspects of design • colour perception is a combination of physiological (sensing in the eye and cognitive processing) and psychological reactions • colour evoke emotions. subjective reaction to colour • connotative meanings of colour. See Dent (1999, page 295)
Defining colour • cultural specific. also colour blindness. 7% of men and 1% of women • warm colours (red, orange, yellows) • cool colours (violet, blue, greens • defining - hue, saturation, value (HSV) model
hue - basic colour we perceive, eg 12 step wheel value - lightness or darkness. Can be hard to perceive variations in value saturation - intensity or purity compared to a neutral gray
Design and colour • gives structure and readability • developing figure and ground relationships • warm colour better for figures. Said to ‘advance’ to viewer. Cool colours tend to recede • perceptual grouping of like features through colour • colour contrasts. using value or saturation to represent data on thematic maps • qualitative conventions - blue for water, green for lush vegetation; red = warm and blue = cool in temperatures; hill shading
Labelling the map • lettering choice can have a significant impact to effectiveness of the map • typography - practical and ‘personality’ • map text to label features has several key parameters • font typeface, size spacing • placement and orientation • importance of type discernibility • map labels can communicate important data, e.g. hierarchy of features, implying importance • Chislehurst, Bromley, L O N D O N • manual labelling of features can get very tedious. but automatic label placement is still far from perfect
Think about different types of lettering styles and placement/orientations used and the effects it has
Some considerations • from Dent (1999, page 271) • legibility of individual letters is of paramount importance, especially in smaller type sizes. Choose a typeface in where there is little chance of confusion between c and e and i and j • select a typeface with a relatively large base height • avoid extremely bold forms • choose a typeface that has softer shading; extreme vertical shading is more difficult to read than rounder forms • do not use decorative typefaces on the map as they are difficult to read
Code of ethics • for thematic map cartographers, from Dent (1999, page 19) 1. always have a straightforward agenda, and have a defining purpose or goal for each map 2. always strive to know your audience, the potential/likely map users 3. do not intentionally lie with data 4. always show relevant data whenever possible 5. data should not be discarded simply because they are contrary to the position held by the cartographer 6. at a given scale, strive for an accurate portrayal of the data
Code of ethics 7. the cartographer should avoid plagiarizing; report all data sources 8. symbolization should not be selected to bias the interpretation of the map 9. the mapped result should be able to be repeated by other cartographers 10. attention should be given to differing cultural values and principles
Further reading • Borden Dent, (1995) Cartography: Thematic Map Design, fifth edition • Terry Slocum, (1999) Thematic Cartography and Visualization • Menno-Jan Kraak and Ferjan Ormeling, (1996) Cartography: Visualization of Spatial Data