Download
1 / 24
240 likes | 452 Views
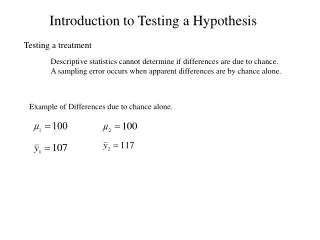
Introduction to Hypothesis Testing. MARE 250 Dr. Jason Turner. Hypothesis Testing. We use inferential statistics to make decisions or judgments about data values Hypothesis testing is the most commonly used method

E N D
Introduction to Hypothesis Testing MARE 250 Dr. Jason Turner
Hypothesis Testing We use inferential statistics to make decisions or judgments about data values Hypothesis testing is the most commonly used method Hypothesis testing is all about taking scientific questions and translating them into statistical hypotheses with “yes/no” answers
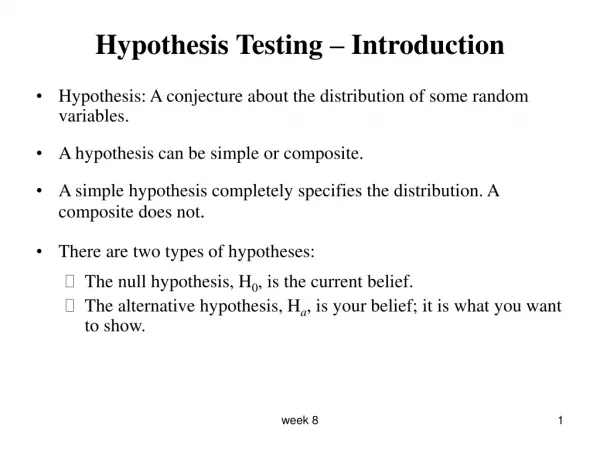
Hypothesis Testing Start with a research question Translate that question into a hypothesis - statement with a “yes/no” answer Hypothesis crafted into two parts: Null hypothesis and Alternative Hypothesis – mirror images of each other
Hypothesis Testing Hypothesis testing – used for making decisions or judgments Hypothesis – a statement that something is true Hypothesis test typically involves two hypothesis: Null and Alternative Hypotheses
Testing…Testing…One…Two Null hypothesis – a hypothesis to be tested Symbol (H0) represents Null hypothesis Symbol (μ) represents Mean H0: μ1 = μ2 (Null hypothesis = Mean 1 = Mean 2)
Testing…Testing…One…Two Research Question – Is there a difference in urchin densities across habitat types? Null hypothesis – The mean number of urchins in the Deep region are equal to the mean number of urchins in the Shallow region H0: μurchins deep = μurchins shallow In means tests – the null is always that means at equal
Testing…Testing…One…Two Three choices for Alternative hypotheses: 1. Mean is Different From a specified value – two-tailed test Ha: μ ≠ μ0 2. Mean is Less Than a specified value – left-tailed test Ha: μ < μ0 3. Mean is Greater Than a specified value – right-tailed test Ha: μ > μ0
Critical Region-Defined We need to determine the critical value (s) for a hypothesis test at the 5% significance level (α=0.05) if the test is (a) two-tailed, (b) left tailed, (c) right tailed 0.025 0.05 0.05 0.025 { { { {
Testing…Testing…One…Two Alternative hypothesis (research hypothesis) – a hypothesis to be considered as an alternative to the null hypothesis (Ha) (Ha: μ1 ≠ μ2 )(Alt. hypothesis = Mean 1 ≠ Mean 2)
Testing…Testing…One…Two Research Question – Is there a difference in urchin densities across habitat types? Null hypothesis – The mean number of urchins in the Deep region are equal to the mean number of urchins in the Shallow region H0: μurchins deep = μurchins shallow Alternative hypothesis - The mean number of urchins in the Deep region are not equal to the mean number of urchins in the Shallow region Ha: μurchins deep ≠ μurchins shallow
Testing…Testing…One…Two Important terms: Test statistic – answer unique to each statistical test; (t-test – t, ANOVA – F, correlation – r, regression – R2) Alpha (α) – critical value; represents the line between “yes” and “no”; is 0.05 P-value – universal translator between test statistic and alpha
Hold on, I have to p P-value approach – indicates how likely (or unlikely) the observation of the value obtained for the test statistic would be if the null hypothesis is true A small p-value (close to 0) the stronger the evidence against the null hypothesis It basically gives you odds that you sample test is a correct representation of your population
Didn’t you go before we left P-value – equals the smallest significance level at which the null hypothesis can be rejected
Didn’t you go before we left P-value – equals the smallest significance level at which the null hypothesis can be rejected - the smallest significance level for which the observed sample data results in rejection of H0 If the p-value is less than or equal to the specified significance level (0.05), reject the null hypothesis, otherwise, do not (fail to) reject the null hypothesis
No, I didn’t have to go then How to we use p? Compare p-value from test to specified significance level (alpha, α=0.05) If the p-value is less than or equal to α=0.05, reject the null hypothesis, Otherwise, do not reject (fail to) the null hypothesis
No, I didn’t have to go then p<0.05 – Reject Null Hypothesis p>0.05 – Fail to Reject (Accept) Null 0.05 – value for Alpha (α)with fewest Type I and Type II Errors
Testing…Testing…One…Two Important terms: Test statistic – answer unique to each statistical test; (t-test – t, ANOVA – F, correlation – r, regression – R2) Alpha (α) – critical value; represents the line between “yes” and “no”; is 0.05 P-value – universal translator between test statistic and alpha
Testing…Testing…One…Two Three steps: 1) You run a test (based upon your hypothesis) and calculate a Test statistic – T = 2.05 2) You then calculate a p value based upon your test statistic and sample size – p = 0.0001 3) Compare p value with alpha (α) (0.05)
Testing…Testing…One…Two Research Question – Is there a difference in urchin densities across habitat types? Null hypothesis – The mean number of urchins in the Deep region are equal to the mean number of urchins in the Shallow region H0: μurchins deep = μurchins shallow Alternative hypothesis - The mean number of urchins in the Deep region are not equal to the mean number of urchins in the Shallow region Ha: μurchins deep ≠ μurchins shallow
Testing…Testing…One…Two Means test is run Output: T = 2.15 df = 59 p = 0.0001 Do we accept or reject the null hypothesis?
Testing…Testing…One…Two p<0.05 – Reject Null Hypothesis Output: T = 2.15 df = 59 p = 0.0001 Since P<0.05 – we reject the null that H0: μurchins deep = μurchins shallow and accept the alternative that Ha: μurchins deep ≠ μurchins shallow
Testing…Testing…One…Two Therefore we reject the Null hypothesis and accept the Alternative hypothesis that: The mean number of urchins in the Deep region are Significantly Different than the mean number of urchins in the Shallow region