Download
1 / 26
260 likes | 631 Views
7.0 Sampling and Sampling Distribution. 7.1 Sampling Methods 7.2 Introduction to Sampling Distribution. Types of Samples. Convenience Sampling. Selection of elements is left primarily to the interviewer. Easy, inexpensive, or convenient to the sample

E N D
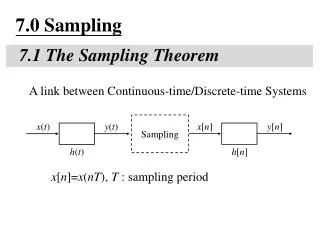
7.0 Sampling and Sampling Distribution 7.1 Sampling Methods 7.2 Introduction to Sampling Distribution
Types of Samples Institut Matematik Kejuruteraan, UniMAP
Convenience Sampling • Selection of elements is left primarily to the interviewer. • Easy, inexpensive, or convenient to the sample • limitations- not representative of the population. • Recommended for pre testing Q, generating ideas, insight @ hypotheses. • Eg: a survey was conducted by one local TV stations involving a small number of housewives, white collar workers & blue collar workers. The survey attempts to elicit the respondents response towards a particular drama series aired over the channel. Institut Matematik Kejuruteraan, UniMAP
JudgmentalSampling • The population elements are selected based on the judgment of the researcher. • From the judgment, the elements are representative of the population of interest. • Eg: testing the consumers’ response towards a brand of instant coffee, Indocafe at a wholesale market. InstitutMatematikKejuruteraan, UniMAP
Simple Random Sampling (SRS) • Definition: • If a sample of n is drawn from a population of N in such a way that every possible sample of size n has the same chance of being selected, the sample obtained is called a simple random sampling. • N – number of units in the population • n – number of units in sample Institut Matematik Kejuruteraan, UniMAP
Simple Random Sampling • Do not have any bias element (every element treated equally). • Target population is homogenous in nature (the units have similar characteristics) • Eg: canteen operators in primary school, operators in cyber cafes, etc.. • Disadvantages: • Sampling frame are not updated. Sampling frame are costly to produce. • Impractical for large study area. Institut Matematik Kejuruteraan, UniMAP
Systematic Sampling • Definition: a sample obtained by randomly selecting one element from the 1stk elements in the frame & every kth element there is called a 1-in-k systematic sample, with a random start. • k – interval size • k = population size sample size = N/n Institut Matematik Kejuruteraan, UniMAP
Systematic Sampling • eg: Let say, there are a total of N=500 primary school canteen operators in the Klang Valley in 1997 who are registered with the Ministry of Education. We required a sample of n=25 operators for a particular study. Step 1: make sure that the list is random(the name sorted alphabetically). Step 2: divide the operators into interval contain k operators. k = population size = 500/25 = 20 for every 20 operators sample size selected only one to represent that interval Step 3: 1st interval only, select r at random. Let say 7. operators with id no.7 will be 1st sample. The rest of the operators selected in remaining intervals will depend on this number. Step 4: after 7 has been selected, the remaining selection will be operators with the following id no. Institut Matematik Kejuruteraan, UniMAP
Stratified Sampling • Definition: obtained by separating the population elements into non overlapping groups, called strata, & then selecting a random sample from each stratum. • Large variation within the population. • Eg: lecturers that can be categorized as lecturers, senior lecturers, associate prof & prof. Institut Matematik Kejuruteraan, UniMAP
Stratified Sampling • Definition: obtained by separating the population elements into non overlapping groups, called strata, & then selecting a random sample from each stratum. • Large variation within the population. • Eg: lecturers that can be categorized as lecturers, senior lecturers, associate prof & prof. Institut Matematik Kejuruteraan, UniMAP
Cluster Sampling • Definition: probability sample in which each sampling unit is a collection, @ cluster of elements. • Advantages- can be applied to a large study areas - practical & economical. - cost can be reduced-interviewer only need to stay within the specific area instead travelling across of the study area. • Disadvantages – higher sampling error. Institut Matematik Kejuruteraan, UniMAP
Cluster Sampling • Definition: probability sample in which each sampling unit is a collection, @ cluster of elements. • Advantages- can be applied to a large study areas - practical & economical. - cost can be reduced-interviewer only need to stay within the specific area instead travelling across of the study area. • Disadvantages – higher sampling error. Institut Matematik Kejuruteraan, UniMAP
7.2.1 Sampling Distribution of Mean ( ) Sample mean will have a theoretical sampling distribution with mean, variance, and standard errors of the sample mean is Institut Matematik Kejuruteraan, UniMAP
The spread of the sampling distribution of is smaller than the spread of the corresponding population distribution. • The standard deviation of the sampling distribution of decreases as the sample size increase. • Consistent estimator ; • the standard deviation of a sample statistics decrease as the sample size increased Institut Matematik Kejuruteraan, UniMAP
Example : • The mean wage per hour for all 5000 employees who work at a large company is RM17.50 and the standard deviation is RM29.90. Let be the mean wage per hour for a random sample of certain employee selected from this company. Find the mean and standard deviation of for a sample size of • 30 • 75 • 200 Institut Matematik Kejuruteraan, UniMAP
Solution Population mean, Population standard deviation, (a) Mean, Standard Deviation Institut Matematik Kejuruteraan, UniMAP
Central Limit Theorem • If we are sampling from a population that has an unknown probability distribution, the sampling distribution of the sample mean will still be approximately normal with mean and standard deviation , if the sample size is large Institut Matematik Kejuruteraan, UniMAP
Example • An electronic firm has a total of 350 workers with a mean age of 37.6 years and a standard deviation of 8.3 years. If a sample of 45 workers is chosen at random from these workers, what is probability that this sample will yield an average age less than 40 years? Institut Matematik Kejuruteraan, UniMAP
Solution Population mean, years Population SD, years Population size Random sample size ,n=45 So sample mean, years Sample SE, Institut Matematik Kejuruteraan, UniMAP
Now as the sample size , then by Central Limit Theorem, we have • The probability that the sample will yield an average age less than 40 years is 0.9808 Institut Matematik Kejuruteraan, UniMAP
7.2.2 Sampling Distribution of Propotion ( ) • The population and sample proportion are denoted by and , respectively, are calculated as, and where • N = total number of elements in the population; • X = number of elements in the population that possess a specific characteristic; • n = total number of elements in the sample; and • x = number of elements in the sample that possess a specific characteristic. Institut Matematik Kejuruteraan, UniMAP
Example In a recent survey of 150 household, 54 had central air conditioning. Find and where is the proportion of household that have central air conditioning. Solution Since Institut Matematik Kejuruteraan, UniMAP