Download
1 / 36
360 likes | 514 Views
Ocean Color Remote Sensing Pete Strutton, COAS/OSU. Outline What do we mean by ‘Ocean Color’? How are the measurements made? What parameters can be derived? What are these data used for? Where are the data?. Components of a remote sensing system. sensor. source. raw data. signal.

E N D
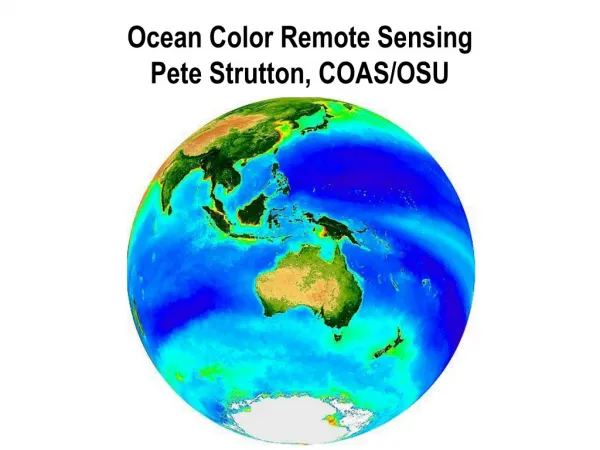
Ocean Color Remote Sensing Pete Strutton, COAS/OSU
Outline What do we mean by ‘Ocean Color’? How are the measurements made? What parameters can be derived? What are these data used for? Where are the data?
Components of a remote sensing system sensor source raw data signal processing / dissemination cal/val
Ocean color (chlorophyll) Passive measurement - energy source is the Sun In contrast to altimetry, SST etc, looks at subsurface, not ‘skin’ Measures light emitted from the ocean (careful to distinguish between ‘emission’ and ‘reflection’) Actual parameter measured (raw data) is normalized water leaving radiance, often denoted nLw Most of the signal (>90%) at the satellite is NOT ocean color - atmospheric interference Also interference from other colored material in the ocean sediments, ‘colored dissolved organic matter’ (CDOM)
u NADP + 2H+ NADPH2 2 e- LHC ADP+P ATP Fluorescence ff heat fh Chlorophyll / ocean photosynthesis
The ocean color measurement and how it’s used Main signals: Atmosphere,reflection and ocean color Lw Et
Measuring chlorophyll from space The Sea-viewing Wide Field of view Sensor: SeaWiFS The satellite The instrument
What SeaWiFS sees in one day The gap here is caused by the satellite tilting as it passes over the equator
Clouds Severity varies with location and season When viewing multi-day composites, variable ‘sample size’ Coastal fog can have the same effect as clouds Other complicating factors Colored dissolved organic matter (CDOM) - mostly breakdown products from phytoplankton and terrestrial sources. Other components of river runoff such as sediments. Diminished in open ocean, aka Case I waters
Chlorophyll fluorescence Light energy not used for photosynthesis is lost as heat and fluorescence Fp +Ff + Fh = 1 u NADP + 2H+ NADPH2 2 e- LHC ADP+P ATP Fluorescence ff heat fh
Blue light induced chlorophyll fluorescence in Tobacco leaf. A. photographed in white light. B. taken in the low steady state of fluorescence, 5 min after the onset of illumination. The bright red fluorescing upper part of the leaf is where photosynthesis has been blocked by the herbicide duiron (DCMU). (From Krause and Weis, 1988) u e- PSI LHC (ATP & NADPH2) L683 heat u DCMU PSI LHC (ATP & NADPH2) L683 heat Fp + Ff + Fh = 1
FLH vs. chlorophyll FLH vs. CDOM
MODIS Terra L2 1 km resolution scene from October 3rd 2001 Sea Surface Temperature Chl a Chl Fluorescence Line Height (°C) (mg m-3) (W m-2 mm-1 sr-1) From OSU-COAS EOS DB Station
Chlorophyll fluorescence from space Passive measurement (sun is the initial source) Offers the possibility of phytoplankton physiology from space Also potentially a chlorophyll proxy that is unaffected by: Sediments Other colored material However, signal is very small, and our understanding is evolving
Satellite-based productivity algorithms Motivation: Chlorophyll measurements give biomass, we want productivity (rate) Global coverage 1000s of 14C measurements of primary productivity have been made and continue to be made Do not accurately reflect global temporal and spatial variability Need models of primary productivity - take satellite data as input and provide integrated primary productivity as the output Allows us to quantify the spatial distribution of productivity, but also… Temporal changes at time scales from days to decades (NASA's main goal)
Other Ocean Color Parameters Particulate Organic Carbon (POC): Potentially more useful for carbon budgets than phytoplankton chlorophyll Particulate Inorganic Carbon (PIC): Indicative of a specific type of phytoplankton (coccolithophorids), common in polar waters. Photosynthetically Available Radiation (PAR) Diffuse attenuation coefficient Terrestrial biosphere products
The sensors and data SeaWiFS: Launched 1997, very successful, well-calibrated and still operating. MODIS Aqua: Launched 2002, has fluorescence channel that SeaWiFS lacks. Data available at spatial resolutions from ~1km to 9km Data available at daily resolution with the caveats previously discussed Data gateway depends on user: NASA directly, CoastWatch, others…


