Download
1 / 1
10 likes | 249 Views
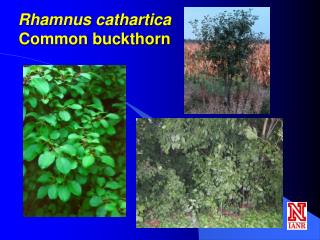
The Effects of European Buckthorn Rhamnus cathartica on Soil Properties in a Riparian Forest O. Norman, T . Tracy, S. Burmakow, and H . Craven Department of Biology, Northwestern College, Orange City, Iowa. ABSTRACT

E N D
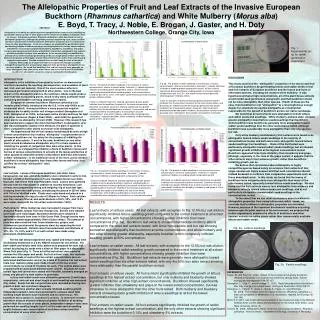
The Effects of European Buckthorn Rhamnus cathartica on Soil Properties in a Riparian Forest O. Norman, T. Tracy, S. Burmakow, and H. Craven Department of Biology, Northwestern College, Orange City, Iowa ABSTRACT This study explored the effects of the invasive shrub European buckthorn Rhamnus cathartica on soil properties in Northwestern College's riparian forest near Alton, Iowa. We tested moisture, carbon, phosphate, and nitrogen content of soil samples collected in early November from the center of each of 15 treatment plots (in which buckthorn shrubs have been removed) and 15 control plots (in which buckthorn shrubs were left standing). In control plots, we found a significant direct relationship between buckthorn density and soil nitrogen levels and a significant inverse relationship between buckthorn density and soil phosphorus levels. Both of these findings suggest that buckthorn alters soil nutrient levels; however, we found no significant differences in phosphorus and nitrogen levels between treatment and control plots, suggesting that the perceived relationship between buckthorn density and soil nutrient levels could be an artefact of an environmental gradient unrelated to buckthorn density. Long-term soil testing at various times of year will enable us to determine more conclusively whether buckthorn is altering soil properties in Northwestern's forest. INTRODUCTIONEuropean Buckthorn Rhamnus cathartica is an invasive shrub/tree that is dominating many forests in eastern North America (Mascaro and Schnitzer, 2007;Gourley and Howell 1984; Boudreau and Willson 1992). Researchers have found various negative ecological effects of buckthorn, including increased nest predation in songbirds (Schmidt & Whelan 1999), decreased herbaceous groundcover (Boudreau & Wilson 1992), decreased juvenile recruitment by canopy trees (Fagan & Peart 2004), and the hosting of crown rust (USDA) and overwintering soybean aphids (Yoo et al. 2005). Many theories have been put forth about the reason for Buckthorn success in the forests, including the theory that Buckthorn makes the soil composition less conducive to the growth of native vegetation by altering soil properties such as moisture and nitrogen content (Heneghan et al. 2004). In this experiment, we tested the hypothesis that buckthorn affects soil properties and predicted a) that plots containing buckthorn would have a significant difference in their carbon, nitrogen, phosphorus and/or water content compared to plots where all buckthorn shrubs have been removed, and b) that carbon, nitrogen, phosphorus, and water content of soil would correlate with buckthorn density. Treatment vs. control plots RESULTS We found no significant difference between treatment and control plots for water (p=0.57), carbon (p=0.96), nitrogen (p=0.66), and phosphorus content (p=0.70) of soil (Fig. 1). Likewise, we found no relationship between buckthorn density and either water (r=0.03; p=0.57) or carbon content (r=0.12; p=0.23; Fig. 2A and 2B). Conversely, we found a significant direct relationship between buckthorn density and nitrogen content (r=0.31; p=0.031) and a significant inverse relationship between buckthorn density and phosphorus content (r=0.27; p=0.047; Fig. 2C and 2D). r=0.03; p=0.57 Figure 1. Means and standard deviations for treatment and control plots. Water, carbon, nitrogen, and phosphorus content did not significantly differ between treatment and control plots. MATERIALS AND METHODS Northwestern’s forest is a 5-acre secondary successional floodplain forest along the Floyd River, near Alton, Iowa. The forest canopy is dominated by silver maple Acer saccharinum, boxelderA. negundo, and white mulberry Morus alba, with European buckthorn and small black currant Ribesnigrum shrubs dominating a patchy woody understory. Buckthorn first appeared in the forest around 1998. Four acres of Northwestern's forest were divided into 30 abutting 20m2 plots in September 2005. Trees and shrubs were then surveyed by identifying and counting every tree and shrub at least 0.5m tall within each study plot. Buckthorn seedlings between 0.5m and 1.5m were also counted. Treatment and control plots were then paired according to proximity (most paired plots abutted) and similarities in buckthorn and tree/sapling composition using Peterson's Homogeneity index. All buckthorn were removed from treatment plots, while only fruiting female buckthorn were removed from control plots (to prevent spread). Plots were resurveyed and buckthorn seedlings were removed from treatment plots semi-annually from 2006 through 2010. In November 2010, we collected soil samples from the center of each plot by using a bulb auger to dig up two plugs of soil ~30cm apart. We then cut each plug between the second and third inch from the top, placed the inch of soil in a labeled Ziploc baggie, and discarded the rest of the soil. In the lab, we removed organic material such as roots from all soil samples and thoroughly mixed each plot's two soil samples. Water and Carbon Content We ground soil samples from each plot using a mortar and pestle, and placed 5 g of soil from each plot into aluminum boats. These samples were then placed in an incubator at 80 ºC to dry; a week later we weighed the dried soil samples again to determine water content. We then baked the samples in a muffle furnace at 500 ºC for 4 hours, after which time we weighed them again to determine the carbon content. Nitrogen and Phosphorus After running the soil samples through wire mesh to break down the soil particles and create more uniformity, we used LaMotte Soil Test Kit to perform nitrogen and phosphorus tests. We filled 30 test tubes with 3.5 ml of Nitrogen Extracting Solution and added exactly 0.50 g of soil from each plot to its tube. We shook each tube for one minute and then set the tubes aside to settle. We transferred 3.0 ml of each tube's supernatant into new tubes, added 0.25 g of Nitrogen Indicator Powder to each tube, and thoroughly mixed. Tubes were allowed to settle for 5 minutes. We then extracted the supernatant and used a spectrophotometer to test the solution's absorbance at 543nm. We filled 30 test tubes with 6ml of a Phosphate Extracting Solution and added exactly 1.50 g of soil from each plot to its tube. We shook each tube for one minute and then set the tubes aside to settle. We transferred 3ml of the supernatant into a second tube, into which we added six drops of Phosphorus Indicator Reagent. We capped and mixed each tube, then added a Phosphorus Test Tablet, recapped and thoroughly mixed the contents. Tubes were allowed to settle for 5 minutes. We then extracted the supernatant and used a spectrophotometer to test the solution's absorbance at 620nm. Statistical analyses We ran paired t-tests to compare water content (%), carbon content (%), phosphorus content (absorbance), and nitrogen content (absorbance) between treatment and control plots. For control plots only, we performed correlation/regression analyses on log-transformed buckthorn data to test for a relationship between buckthorn density and each of these soil properties. r=0.03; p=0.57 DISCUSSION In this experiment, we tested the hypothesis that European buckthorn alters forest soil properties. We collected soil samples from treatment (buckthorn removed) and control plots at Northwestern's riparian forest near Alton and tested samples for water, carbon, nitrogen, and phosphorus content. In control plots, we found a significant direct relationship between nitrogen levels and buckthorn density in control plots and a significant inverse relationship between phosphorus levels and buckthorn density. However, we did NOT find significant differences between treatment and control plots in any of the tested soil properties. The significant relationships found in the control plots suggest that buckthorn may alter nitrogen and phosphorus levels in soil. However, the non-significant differences found between treatment and control plots makes this less likely. However, there are seveal possible mechanisms by which the differences between treatment and control plots might be minimized: 1) Our research plots abut, and some of the leaves from buckthorn growing in control plots become leaf litter in treatment plots, thus affecting the soil content of the treatment plots; 2) Treatment plots have been experiencing constant re-invasion pressure: Dozens of buckthorn seedlings were removed from treatment plots in summer 2010, and these invaders may be making the soil of the treatment plots more like the soil in control plots; 3) It is possible that the buckthorn eradication efforts in 2005 are recent enough that the soil in treatment plots still retain some buckthorn-like properties. Indeed, Heneghan et al. (2004) describe a "legacy effect" in the soil of areas cleared of buckthorn. Our findings of a direct relationship between buckthorn density and nitrogen levels concur with the findings of Heneghan et al. (2004) in Illinois. However, they also found higher carbon and water content in buckthorn soil, while we found no significant relationships for carbon or water. However, our study area had received considerable rainfall in the days just prior to our soil sampling, which may have minimized differences in soil moisture content. Given the equivocal nature of our findings, long-term soil testing at various times of year are needed to help us determine more conclusively whether buckthorn is altering soil properties in Northwestern's forest. Furthermore, if buckthorn IS altering soil properties, the effects of the soil changes on native plants and invertebrates remain obscure and warrant investigation. Figure 2A.Water content of soil sample for each plot vs. number of buckthorn in plot. No significant relationship was found using log-transformed data for buckthorn density. r=0.12; p=0.23 Figure 2B. Carbon content of soil sample for each plot vs. number of buckthorn in plot. No significant relationship was found using log-transformed data for buckthorn density. r=0.31; p=0.031 Figure 2C. Nitrogen absorbance of soil sample for each plot vs. number of buckthorn in plot. A significant direct relationship was found using log-transformed data for buckthorn density. r=0.27; p=0.047 REFERENCES Boudreau, D & G. Wilson. 1992. Restoration & Management Notes 10:94-95. Fagan, M. & D. Peart. 2004. Forest Ecology and Management 194:95-107. Gourley, L. C. & E. Howell. 1984. Restoration and Management Notes 2:87. Heneghan, L., C. Clay, & C. Brundage. 2002. Ecological Restoration 20:108-111. Mascaro, J. & S. Schnitzer. 2007. Northeastern Naturalist 14:387-402. Schmidt, K. & C. Whelan. 1999. Conservation Biology 13:1502-1506. USDA Agricultural Research Service. http://www.ars.usda.gov/Main/docs.htm?docid=9921 Yoo, H., R. O’Neil, D. Voegtlin, & W. Graves. 2005. Annals of Entomological Society of America 98:926-930. Figure 2D. Phosphorus absorbance of soil sample for each plot vs. number of buckthorn in plot. A significant inverse relationship was found using log-transformed data for buckthorn density.