Download
1 / 11
110 likes | 247 Views
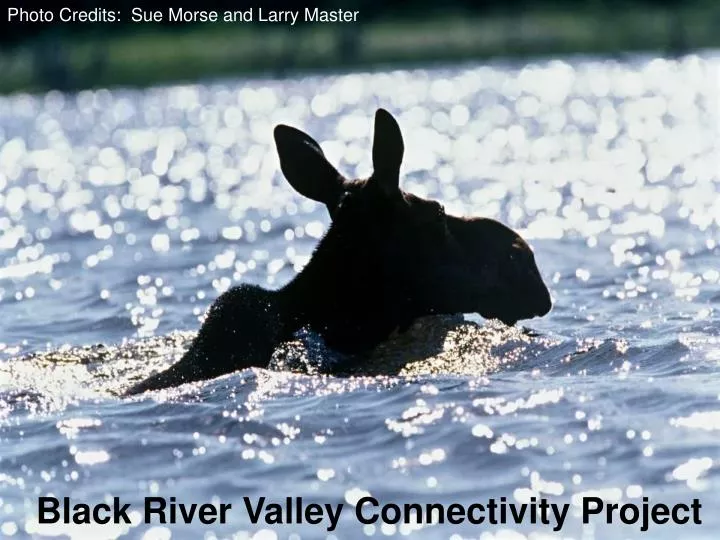
Photo Credits: Sue Morse and Larry Master. Thanks to Sue Morse for photos. Black River Valley Connectivity. Black River Valley Connectivity Project. Regional Priority. Project Area. Project Status. Milestones Secured planning grants (BRI, LTA) Steering committee launched - January 2007

E N D
Photo Credits: Sue Morse and Larry Master Thanks to Sue Morse for photos Black River Valley Connectivity Black River Valley Connectivity Project
Project Status Milestones • Secured planning grants (BRI, LTA) • Steering committee launched - January 2007 • Connectivity modeling – Spring 07-Fall 08 • 3-5 year strategic plan elements in place Steering Committee Representation • Department of Environmental Conservation • Department of Transportation • Tug Hill Commission • Tug Hill Tomorrow • Wildlife Conservation Society • Major private landowner
Focal Species • Bear • Cougar • Lynx • Marten • Moose • Otter • Tanager
Least Cost Path Identifies the least costly route for an organism to move from one destination to another. • Inputs: • Habitat suitability grid • Barriers grid
FunConn Assess the landscape based on animal perception. Graph theory considers all habitat patches and distance/ barriers between them to identify most important connections and patches. Methods: I. Create habitat quality II. Define functional patches III. Build landscape network
Results - Least Cost Path All species preferred areas Number of species per pixel Summed Corridors
Results - FunConn All species preferred areas Number of species per pixel
Implementation Using the results: I. Research agenda • Strategy development • Land protection • Barrier mitigation • Land use planning • Outreach