Download
1 / 11
110 likes | 267 Views
Stats Rock. Using Pet Rocks to Find the Mean, Median and Interquartile Range (IQR). Data Set. A data set is a collection of data. It can be the ages of your classmates, the number of pets you own, or the weight of your Pet Rock. Mean and Median.

E N D
Stats Rock Using Pet Rocks to Find the Mean, Median and Interquartile Range (IQR)
Data Set A data set is a collection of data. It can be the ages of your classmates, the number of pets you own, or the weight of your Pet Rock.
Meanand Median The Mean, Median and Mode Toads found on YouTube at http://www.youtube.com/watch?v=5C9LBF3b65s
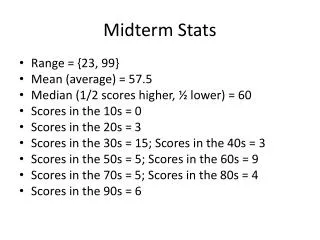
Mean of a Data Set This data set represents the number of hours spent doing homework by 6th grade students. Given the data set (3,5,6,4,2,0,1,4 ) we will find its mean, median and interquartile range (IQR). STEP 1: In order to find the mean (also called average) of a data set you first add all the pieces of data together. So we do the following: 3+5+6+4+2+0+1+4= 25 STEP 2: Now we count the number of pieces of data in our data set. We have 8 pieces of data. STEP 3: Finally we divide the sum of the pieces of data by the number of pieces of data. So, 25 ÷ 8 = 3.125 We will round our decimal answers to the nearest hundredths place. Our mean is 3.13.
Let’s Practice Finding the Mean 15.83 15.67 Find the mean of the data set representing the number of guests at a birthday party. (25,30,15,10,5,10) Round your answer to the nearest hundredths place. Find the mean of the data set representing the number of presents you received at your last birthday party. ( 20 ,50,3,10,1,10) Round your answer to the nearest hundredths place.
Median of a Data Set Using the same data set about the number of hours spent by 6th graders doing homework (3,5,6,4,2,0,1,4), we will find its median. STEP 1: Place the data set in order from smallest to largest value(including all the repeating values). Place them in order just like they appear on the number line. So our data set now looks like (0,1,2,3,4,4,5,6) STEP 2: Now look for the middle number in the data set. Since we have an even number of data points, the median will be found between numbers 3 and 4. In this case the median is found by adding the two numbers (3+4) and dividing by 2. This gives us 3.5 as the median. NOTE: In the case where you have an odd number of data points in the data set, the median is just the middle number (Ex. In the data set (1, 5, 11,12,14) the median is 11.
Let’s Practice Finding the Median Order the data set (5,10,10,15,25,30,31) The median is the middle number which is 15. Order the data set (1,3,10,11,20,50). The median will be the number between 10 and 11. So, 10 + 11 = 21 ÷2 = 10.5. The median is 10.5 Find the median of the data set representing the number of guests at a birthday party. (25,30,15,10,5,10,31) Find the median of the data set representing the number of presents you received at your last birthday party. ( 20 ,50,3,10,1,11)
Interquartile Range (IQR) The interquartile range (IQR) is a measure of variability in our data set. The data points in our data set are divided into 4 quartiles. The IQR is the difference between the third quartile Q3 and the first quartile Q1. The IQR will contain the middle 50% of the data points in your data set.
More About the Interquartile Range (IQR) Q1 Q2 Q3 25% 25% 25% 25% The middle 50% of your data is the IQR The interquartile range (IQR) is = Q3 – Q1
How to find the Interquartile Range Let’s see how to find the Interquartile Range How to Find An Interquartile Range found on YouTube http://www.youtube.com/watch?v=R6VDj7pEG30
Let’s Practice Finding the IQR First order the data set (5,10,10,15,25,30,31). Find the median of the data set = 15. Find the Q3 = 30. Find Q1 =10. IQR = Q3 – Q1 = 20 First order the data set (1,3,10,11,20,50). Find the median of the data set = 10.5. Find the Q3 = 20. Find Q1 =3. IQR = Q3 – Q1 = 17 Find the IQR of the data set representing the number of guests at a birthday party. (25,30,15,10,5,10,31) Find the median of the data set representing the number of presents you received at your last birthday party. ( 20 ,50,3,10,1,11)