Download
1 / 34
360 likes | 445 Views
ASEN 5070: Statistical Orbit Determination I Fall 2013 Professor Brandon A. Jones Professor George H. Born Lecture 6: Linearization of OD Problem. Announcements. Lecture Quiz – Due before Class Homework 2– Due September 13. Today’s Lecture. Time of Periapse Passage Linearization

E N D
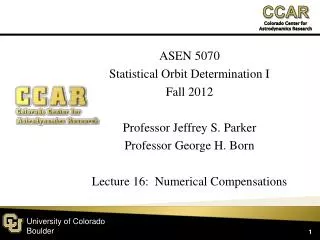
ASEN 5070: Statistical Orbit Determination I Fall 2013 Professor Brandon A. Jones Professor George H. Born Lecture 6: Linearization of OD Problem
Announcements • Lecture Quiz – Due before Class • Homework 2– Due September 13
Today’s Lecture • Time of Periapse Passage • Linearization • Chapter 4 of book, now through mid-October
Tp Calculation Tp is determined from the following equations: However, as time t increases, Tp is not constrained to an orbital period and thus increases as a step function. To resolve this, MOD Tp with the orbital period. A situation may arise in which the calculation for the mean Anomaly, M, and true anomaly, ν, do not agree resulting in the mean anomaly to be past perigee while the true anomaly is behind perigee (this is an artifact of numerical integration).
Tp Calculation To correct this, we will introduce the angle of periapseθp: From this, one will notice that the artifacts do not occur when Thus, constraining θp to be between –π to π will remove the artifacts. The angle of periapseθpcan then be converted back to time of periapseTp by
Tp Results Artifacts
General Estimation Problem • How do we estimate X ? • How do we estimate the errors εi? • How do we account for force and observation model errors?
Cost Function J(x) • We introduce a “cost function” that we seek to minimize • We now select X to minimize J(X) • No longer estimating εi! • This gives us n+p×lequations and only n unknowns • This is known as: Least Squares Estimation
Derivation of the Normal Form • What is one way to find the minimum of J ? • Differentiate with respect to x • Find the point where dJ/dx = 0 • Make sure the matrix of second-order partials is positive definite For now, assume G is a linear function
Least Squares: Derivation of Normal Form For now, assume G is a linear function • Differentiate with respect to x. What is the answer?
Least Squares Minimum Requirement • In order for the normal equation to yield a minimum of the cost function • In other words, HTH must be what?
Normal Form of Least Squares Estimator • This is the “normal form” of the least squares estimator • Other methods of minimizing J(x) exist • Singular value decomposition • Orthogonal transformations • Etc. • We assume the state-observation relationship was linear, but the orbit determination problems is nonlinear • We will linearize the formulation of the problem
General Estimation Problem • In general, the problems are nonlinear in dynamics and/or observations • This course primarily discusses methods based on linearization • What is required to “linearize” the problem? Vector of Estimated Values Vector of Observations at ti
Deviation Vectors • We will define lower-case vectors as representing a linear system • For a linear system, this is the vector of interest • For a nonlinear system, these are deviation vectors • In general, we do not know the truth. Hence, we must estimate deviation relative to the reference • If we have a nonlinear observation or state dynamics model, we have to use a fully linearized form! Deviations Truth Reference
Linearize About Reference • We generate linearized models about the reference trajectory, which are a function of the deviation vectors
And the answer is: • Which terms are non-zero?
And the answer is: • Which terms equal 1? • What are the partials w.r.t. μ?
And the answer is: • What is the final answer?
Linearize the Obs. Model Computed, not measured values!
State Transition Matrix • Since x is linear (note lower case!) then there exists a solution to the linear, first order system of differential equations: • The solution is of the form: • Φ(t,t_i) is the state transition matrix (STM) that maps x(ti) to the state x(t) at time t.
STM Differential Equation Constant! • What is the differential equation?
Methods to Generate the STM • There are four methods to generate the STM: • Solve from the direct equation (next lecture) • If A is constant, use the Laplace Transform or eigenvector/value analysis • Analytically integrate the differential equation directly • Numerically integrate the equations (ode45)