Download
1 / 28
280 likes | 415 Views
Analysis of City of Hamilton Expenses. Civic League Financial Sub-team January 8, 2013. Present information that informs and motivates citizens to increase involvement in municipal affairs Identify topics to become issues in 2014 municipal election. Truth in Numbers.

E N D
Analysis of City of Hamilton Expenses Civic League Financial Sub-team January 8, 2013
Present information that informs and motivates citizens to increase involvement in municipal affairs • Identify topics to become issues in 2014 municipal election Truth in Numbers
Obtained data from the Ministry of Municipal Affairs and Housing website for Financial Information Reporting (FIR) and Municipal Performance Measuring Program (MPMP) • Used data from reports for 2002 to 2011 • Amalgamated city’s first year was 2002 • Looked at data for • Salaries, wages and benefits • Materials • Contracted services • Number of employees • Number of citizens and households • Fire, Police and Waste Management Methodology
Consumer Price Index (CPI) • CPI has increased by 19.9% • from 100 in 2002 to 119.9 in 2011 • 2.2% / year
City’s population has increased by 8.3% • from 490,270 in 2002 to 531,057 in 2011 • 0.9% / year • City’s households have increased by 9.3% • from 194,155 in 2002 to 212,262 in 2011 • 1.0% / year Population and Number of Households
City’s full-time funded employees have increased 6.8% • from 5,895 in 2002 to 6,296 in 2011 • City’s part-time funded employees have decreased by 65.1% • from 4,631 in 2002 to 1,618 in 2011 • City’s seasonal employees have decreased by 90.7% • from 838 in 2002 to 78 in 2011 Number of employees
Total salaries, wages and employee benefits have increased by 61.2% • from $388MM in 2002 to $625MM in 2011 • 6.8% / year • Salaries and wages have increased by 37.6% • From $354MM in 2002 to $487MM in 2011 • 4.2% / year • Benefits have increased by 310.8% • From $33MM in 2002 to $137MM in 2011 • 34.5% / year Compensation Spending
Compensation If compensation had grown at the same annual rate as the CPI, spending on compensation would be 32% less than it is today For 2011, this equates to $153MM Totaling the annual differences from 2002 to 2011, actual compared to CPI growth, the City has “over compensated” by $892MM
Net taxation available for municipal purposes in 2011 was $720 MM • 86.8% of net taxation is used to pay for salaries, wages and employee benefits Compensation and Taxes
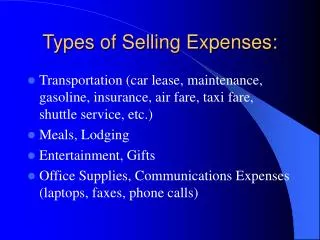
Materials and Contracted Services Spending • Materials have increased by 43.0% • from $163 Million in 2002 to $234 Million in 2011 • 4.8% / Year • Contracted Services have increased by 102.2% • from $89 Million in 2002 to $181 Million in 2011 • 11.3% / Year
Why are expenses increasing faster than the population and households? • Why are expenses increasing faster than the CPI? • Why are employee benefits increasing so fast? • Why are contracted services increasing so fast? Questions
Policing Services Spending • Policing operating costs per citizen have increased by 25.3% • from $214/citizen in 2005 to $269.27 citizen in 2011 • 4.2% / Year • Total crime rate has decreased by 15.8% • from 63 in 2005 to 53 in 2011 • 2.6% / Year
Why is the cost of policing increasing faster than the population and households? • Why is the cost of policing increasing while the total crime rate is falling? Questions
Fire Services Spending • Fire Services operating costs per have increased by 44% • from $55.9MM in 2005 to $80.5 in 2011 • 7.3% / Year
Why are Fire Services costs increasing faster than the households? Question
Waste Management Costs • Collection costs increased 69% from 2005 to 2011 • 11.5% per year • Disposal costs increased 102% from 2005 to 2011 • 17% per year • Diversion costs increased 60% from 2005 to 2011 • 10% per year • Combined costs increased 77% from 2005 to 2011 • 12.8% per year • Total tonnage handled decreased 12% from 2005 to 2011 • 2% per year
City of Hamilton’s expenses are too high • High salaries, wages and employee benefits costs make the City increasingly dependent upon higher taxes, higher user fees and funding from federal and provincial sources • City of Hamilton needs to improve efficiency • City of Hamilton needs to understand their cost drivers • City of Hamilton needs to review their procurement practices Conclusions
Pension plan going forward converted from defined-benefit to defined-contribution • Eliminate banking of sick days • Restrict vacation carry-over to 2 weeks • Reduce number of employees through attrition, i.e. do not hire to replace all retirees • Re-deploy employees to highest priorities • Require retirees to pay 50% of their medical benefits • Approve expenses based on efficiencies and service levels Possible Solutions