Download
1 / 43
430 likes | 636 Views
Profiling Dietary Supplement Use: Current Data and Challenges. Office of Dietary Supplements Conference Bioavailability of Nutrients and Other Bioactive Components of Dietary Supplements: Defining the Research Agenda January 5, 2000 James T. Heimbach, Ph.D., F.A.C.N.

E N D
Profiling Dietary Supplement Use: Current Data and Challenges Office of Dietary Supplements Conference Bioavailability of Nutrients and Other Bioactive Components of Dietary Supplements: Defining the Research Agenda January 5, 2000 James T. Heimbach, Ph.D., F.A.C.N. Mary M. Murphy, M.S., R.D. Judith S. Douglass, M.S., R.D. ENVIRON International Corporation
“The Growing Self-CareMovement” • Telephone survey of 1000 food shoppers • Interviewing February-March, 1999 • Sponsored by Prevention Magazine and the Food Marketing Institute (FMI)
“The Growing Self-CareMovement”(Prevention/FMI Survey) Products used to maintain health19981999 OTC medications 85% 76% Vitamins & minerals 67% 72% Fortified foods NA 66% Herbal remedies 28% 36% Homeopathic remedies 15% 17%
“The Growing Self-CareMovement”(Prevention/FMI Survey) Use to Use to preventtreat coldscolds Vitamins & minerals 60% 50% Herbal remedies 32% 34%
“Consumer Perceptions and Useof Vitamins & Herbal Products” • Telephone survey of 2,000 individuals age 18+ • Interviewing winter, 1998-99 • Sponsored by Leiner Health Care Products (used by permission)
“Consumer Perceptions and Useof Vitamins & Herbal Products”(Leiner Health Care Products) Take a vitamin supplement daily 55% • Multivitamin 45% • Vitamin C 24% • Vitamin E 22% • Vitamin A 3% • Zinc 5% • Iron 3% Take an herbal product daily 14% • Ginkgo 6% • Ginseng 5%
“Consumer Perceptions and Useof Vitamins & Herbal Products”(Leiner Health Care Products) Vitamin/ Herbal Why take product MineralProduct • General health 40% 41% • Prevent illness 30% 20% • Compensate for poor diet 26% -- • Improve energy -- 10% • Improve memory -- 10%
National Nutrition Monitoring and Related Research Program (NNMRRP) • Established by the National Nutrition Monitoring and Related Research Act of 1990 (Public Law 101-445) • Encompasses “the set of activities necessary to provide timely information about the role and status of factors that bear on the contribution that nutrition makes to the health of the people of the United States.”
National Nutrition Monitoring and Related Research Program: Five Components • dietary, nutritional, and health status measurements • food consumption measurements • food composition measurements and nutrient data banks • dietary knowledge and attitude measurements • food supply and demand determinations
National Nutrition Monitoring and Related Research Program: Keystone Surveys • National Health and Nutrition Examination Surveys (DHHS/CDC/NCHS) • NHANES III, 1988-1994 • Nationwide Food Consumption Surveys (USDA/ARS) • Continuing Surveys of Food Intakes by Individuals (CSFII 1994-96)
National Nutrition Monitoring and Related Research Program: Other Major Surveys • National Health Interview Surveys (DHHS/CDC/NCHS) • Annual NHIS (since 1957) • Split-sample design with variable modules • Various surveillance surveys (DHHS/CDC) • Health and Diet Survey (DHHS/FDA) • Special surveys
Third National Health and Nutrition Examination Survey(NHANES III) • Period covered: • Fall 1988 to Fall 1994 • Number of respondents: • 33,994 interviewed • 31,311 examined • Data obtained: • food consumption measurements (1 day) • dietary, nutritional, and health status measurements
Key indicators: food & nutrient intakes body measurements hematological tests biochemical analyses of whole blood & serum blood pressures EKGs urine tests bone densiometry dental exams gallbladder ultrasonography cognitive & physical functioning Third National Health and Nutrition Examination Survey(NHANES III)
1994-96 Continuing Surveys of Food Intakes by Individuals(1994-96 CSFII) • Period covered: • January 1994 to December 1996 • Number of respondents: • 16,103 provided Day-1 data • 15,303 provided 2 days of data • Data obtained: • food consumption measurements on two nonconsecutive days
Current Activities • NHANES IV • similar to NHANES III • in field now • will become continuous • 1998 CSFII Children’s Survey • January 1998 to December 1998 • methodology similar to 1994-96 CSFII • interviewed 5,300 children birth to 9 years • summary data released December 1999 • CD-ROMs available March 2000
Future Plan: Unified NHANES/CSFII • Scheduled to begin January 2001 • Continuous survey • 10,000 respondents per year • oversample African-American, Mexican-American, and low-income populations • 5,000 CATIs providing 2 days of data • 5,000 CAPIs in the MECs providing 1 day of data; 10% sub-sample providing 2 days • CD-ROMs to be released approximately 15 months after completion of each year
Time between surveys-- NHANES I: 1971-74 NHANES II: 1976-80 NHANES III: 1988-94 NHANES IV: 1999- ? NFCS: 1977-78 CSFII: 1985-86 NFCS: 1987-88 CSFII: 1989-91 CSFII: 1994-96 CSFII: 2001- ? “… provide timely information …”
“… provide timely information …” Time from completion of survey fieldwork to release of data-- Old standard: 2-? years New standard: 14-15 months
NutrientBioavailability Not a priority ...
Example:Iron Bioavailability “Non-heme iron absorption from a meal containing meat, fish, or chicken is about 4 times greater than from equivalent portions of milk, cheese, or eggs.” Rossander et al., 1979
+ Ascorbic acid + Heme iron + Other meat factors - Phytic acid - Oxylates - Polyphenols - Calcium phosphate Enhancers and Inhibitorsof Iron Absorption
Proposed Research Paradigm • Link data on enhancers and inhibitors in foods with USDA food codes • Determine, for each eating occasion, the amount of non-heme iron as well as enhancers and inhibitors • Employ iron absorption model to estimate the amount of bioavailable iron
“… factors that bear on the contribution that nutrition makes…” National data regarding consumer use of dietary supplements-- • in CSFII • in NHANES • in NHIS
Dietary Supplementsin CSFII “How often, if at all, do you take any vitamin supplement in pill or liquid form? Would you say-- • Every day or almost every day, • Every so often, or • Not at all?”
Dietary Supplementsin CSFII “Which of these types of supplements do you usually take?” • multivitamin • multivitamin with iron or other minerals • vitamin C and iron • single vitamins or minerals (list) “Do you take a fish oil supplement?” “Do you take a fiber supplement?”
Dietary Supplementsin NHANES “Have you taken any vitamins or minerals in the past month?” “How many vitamin or mineral products do you take?” [list all supplements reported, ask to see container, record product name and manufacturer or distributor]
Dietary Supplementsin NHANES “How often did you take [PRODUCT] in the past month?” “How much [PRODUCT] did you take each time you took it?” “For how long have you been taking this type of product?”
Dietary Supplementsin NHIS • Questions on use of vitamin and mineral supplements were included in 1987 and in 1992 • “Have you taken any vitamin or mineral supplement in the past year?” • Information was obtained on frequency of use of multivitamins and a variety of specific vitamin or mineral supplements
Challenge little change BIG EFFECT
Challenge Product Identification • Brand A • formulation? • Brand B • formulation? • Brand X • ????????????
Challenge Product Characterization Product Consistency
Challenge Survey Respondent Burden Necessary Nice to know Can’t put EVERYTHING into NHANES/CSFII!
Recommendation Examine critically the data needs for dietary supplement ingredients-- • Detailed linkage with food/nutrient intake • General linkage with food/nutrient intake • No needed linkage with food/nutrient intake
Some thoughts on taxonomy... • Vitamins, minerals • Other substances found primarily in foods • Substances found in foods at low levels • Substances not found in foods, but with known/suspected food/nutrient interactions • Substances not found in foods and with no suspected food/nutrient interactions
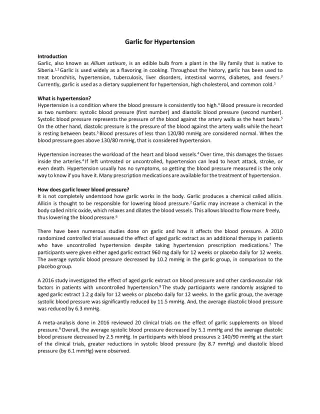
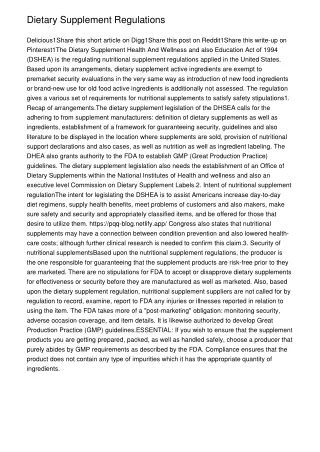
Estimated Usual Intake of IronDiet Alone v. Diet + Supplements(Source: NHANES III)
Estimated Usual Intake of IronDiet Alone v. Diet + Supplements(Source: NHANES III)
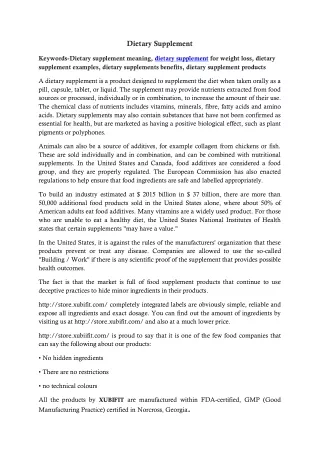
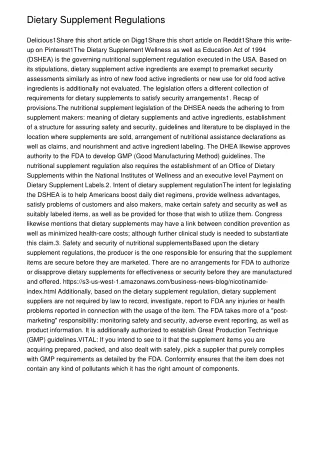
Intake of Vitamin C From FoodsFemales Age 9+(Source: NHANES III)
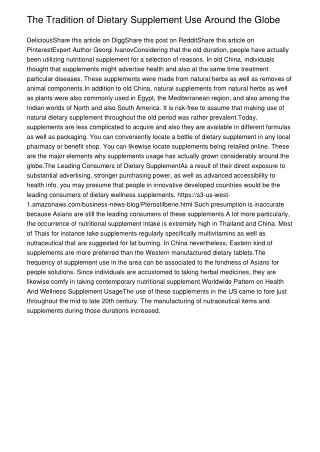
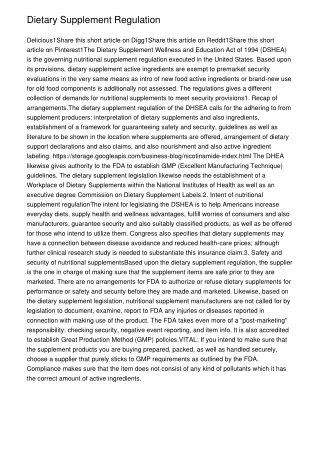
Use of Vitamin C SupplementsFemales Age 9+(Source: NHANES III)