Download
1 / 56
570 likes | 920 Views
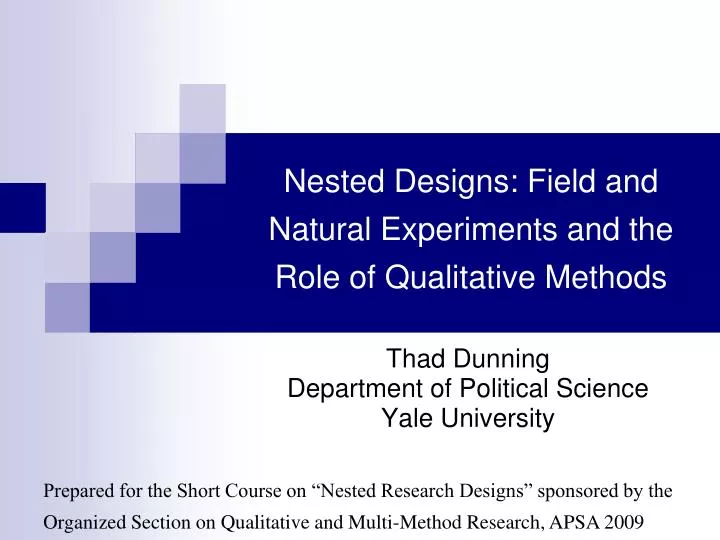
Nested Designs: Field and Natural Experiments and the Role of Qualitative Methods. Thad Dunning Department of Political Science Yale University. Prepared for the Short Course on “Nested Research Designs” sponsored by the Organized Section on Qualitative and Multi-Method Research, APSA 2009.

E N D
Nested Designs: Field and Natural Experiments and the Role of Qualitative Methods Thad Dunning Department of Political Science Yale University Prepared for the Short Course on “Nested Research Designs” sponsored by the Organized Section on Qualitative and Multi-Method Research, APSA 2009
Plan for the talk • Using nested designs to strengthen causal inference, in a comparative project on cleavage structures • Two examples: • Cross-Cutting Cleavages and Ethnic Voting in Mali: A Field Experiment • The Salience of Caste Categories in India: Nesting a Field Experiment within a Natural Experiment • Two of the key points: • Qualitative methods play a central role • External validity concerns arise in both studies; combining experimental and observational data to address them • Practical issues: how feasible are such studies?
Example 1: Cross-Cutting Cleavages and Ethnic Voting • Do cross-cutting cleavages—that is, dimensions of identity or interest along which members of the same ethnic group have diverse allegiances—limit ethnic voting? • Classic insights have been extended in the recent comparative politics and political economy literature • Yet estimating causal effects is difficult
Why no ethnic voting in Mali? • Mali is ethnically heterogenous • Yet parties do not form along ethnic lines • Unlike many sub-Saharan African countries, in Mali ethnicity is a poor predictor of individual vote choice • One hypothesis: “cousinage” • Malians with certain family names are linked through “joking alliances” with their fictive cousins • Two strangers -- say, a Keita and a Coulibaly -- may use cousinage relations to establish rapport and limit interpersonal conflict
Cousinage as a cross-cutting cleavage • The key point: cousinage alliances cross-cut ethnic ties, because they occur across as well as within ethnic groups • Such cross-cutting alliances may weaken the correlation between ethnicity and vote choice • Imagine two voters with the same ethnic relationship to a candidate but different cousinage relations: their preferences over this candidate may diverge • Dunning and Harrison (2008) use a field experiment to study the effect of cousinage and co-ethnicity on candidate preferences • The experimental design can be applied in other contexts
Cousinage in brief • Cousinage relations were codified during the rule of the emperor Sundiata Keita (c. 1235-1255) and exist in Mali, Sénégal, Guinea, the Gambia, the northern Ivory Coast, and Burkina Faso • Though various kinds of cousinage ties exist, we focus here on cousinage alliances between patronyms • Standard jokes are used to establish rapport with “cousins” (though joking is by no means automatic) • Our focus is not on explaining the origins or persistence of cousinage alliances but rather on estimating their causal effects
Experimental Design • Any voter and politician can be placed in this 2x2 table, depending on their relationship with each other: • In Mali, last (family) name conveys information about both ethnic identity and cousinage relations, allowing the classification of voter-politician pairs Joking cousins Not joking cousins Same ethnicity Different ethnicity
Experimental manipulation • We filmed two Malians delivering an identical political speech (in Bambara) and showed the speech to Malian participants • We varied the last name of the politician across different versions of the speech • Each subject was assigned at random, with equal probability, into one of six treatment conditions: • The four cells in the 2x2 table, plus: • A “no name” condition • A “same name” condition
Stimulus: The political speech • The content of the speech was intended to be typical of speeches by candidates to the National Assembly • Themes: need to improve infrastructure, education, electricity • 56 percent of subjects said the speech “reminded them of a speech they had heard on a previous occasion” • The use of Bambara, Mali’s lingua franca, does not imply a particular ethnic identity for the politician • Given politician’s last name, subjects correctly inferred ethnicity more than 85 percent of the time, from 14 ethnic categories • When given no last name, their guesses roughly mirrored the distribution of ethnic groups in Bamako • No difference between the two actors—one of whom was ethnically Peulh, the other of whom was Bambara
Subject recruitment • A door-to-door canvass in all of Bamako’s neighborhoods (quartiers) • A convenience sample -- however, intended to be as representative of Bamako as possible • After subjects agreed to participate, we obtained initial subject data, including last name and self-identified ethnicity • Subjects were then randomized into one of six treatment conditions, shown the video, and administered a post-speech questionnaire
Randomization of Treatment Assignment: Creating a cousinage “map” • A challenge: linking particular last names in the cousinage system • Qualitative (open-ended, semi-structured) interviews played a key role • We used the interviews and drew on the literature to create a cousinage “map,” that is, a matrix: • the rows of which list potential last names of subjects; • the columns of which give last names associated with each of the six treatment conditions
A typical row of the random assignment matrix: (1) (2) (3) (4) (5) (6) Co-ethnic/ cousin Co-ethnic/ non-cousin Non-coethnic/ cousin Non-coethnic/ non-cousin No name Same name • The final matrix has around 200 last names in the first column (the names for potential subjects)
Randomization: creating a cousinage matrix • We had to revise the matrix after initial field trials, using field interviews with informants as well as our initial data to correct errors • An iterative process that very centrally involved qualitative methods • Challenges: • Expanding the left column to include sufficient last names (for ease of subject recruitment) • Improving the match between random assignment and subject perception
Weaknesses of the experimental design • Estimated treatment effects may not be large, for a number of reasons • Stimulus is somewhat artificial? • May not prime ethnicity • May not prime cousinage • Measurement error • Turning to the analysis… • Intention-to-treat analysis • Can the experimental evidence explain the observational relationship?
Average candidate evaluations, by treatment assignment The figure displays average answers to the question: “On a scale of 1 to 7, how much does this speech make you want to vote for (name of candidate)?”
The salience of ethnicity: qualitative evidence • Comments by experimental subjects as well as other field interviewers underscore the social as well as political salience of ethnicity: • An ethnic Bamanan subject: a politician named Guindo (an ethnic Dogon patronym) could never do a good job • An ethnic Bamanan subject: the Dogons “don't know how to lead.” • An ethnic Songhai suggested that Bobo ethnics “don't know anything about politics,” while an ethnic Malinké subject said the same of Dogons. • An ethnic Soninké subject offered the opinion that “the Malinkés are not intelligent.” • Subjects tended to offer more positive comments about co-ethnics. • Subjects were especially prone to praising politicians bearing their own patronyms: • From a subject named Anne: “The Anne family is composed of intellectuals.” • From one subject named Sacko: “A Sacko is a hard worker.” From another: “The Sackos are very cultured.” • From a Kouyate: “if a griot (Djely, Kouyate) is a candidate, it is because he is capable of many things. • From a Koné, explaining why she paid attention to the candidate’s last name: “The Konés are nobles” (the Konés were members of the caste of nobles during the Mali Empire) • A subject named Keita, when asked whether she would be more susceptible of voting for a candidate sharing her family name said “yes, like uncle IBK”—a reference to an opposition candidate during the 2007 presidential elections, whose patronym is Keita.
The salience of cousinage: qualitative evidence • Comments from experimental subjects and other field interviewees underscore the salience of cousinage alliances • Voters anticipate being able to make requests of as well as sanction their cousins • “If (the politician/cousin) is not serious, we will correct him.” (Experimental subject, explaining why she would be more likely to vote for a joking cousin) • “If the politican does not respect his promises, we will bring him to heel, because he is a senanku (cousin).” (Experimental subject, explaining why he would be more likely to vote for a joking cousin) • One can “never hurt (one’s) cousin and “one must do what (one’s) cousin asks.” (Field interview) • Cousinage alliances “result in greater willingness to make voluntary material sacrifices (of resources, time, willingness to voluntarily cede in disputes, etc.)” (Galvan 2006) • “Voters tend to vote for their allies (cousins), saying that in case of problems—administrative, political, or social—the elected ally would be more prompt to intervene than he would be even with a direct member of his own family.” (Douyon 2006) • We cannot fully distinguish mechanisms that explain why cousinage affects political preferences; however, trustworthiness and credibility appear to play an important role
The Effect of Cousinage on Perceptions of Candidate Attributes (Differences of Means, Cousins Minus Non-Cousins) The figure reports the estimated effect of cousinage alliances on subjects’ evaluations of the candidate’s attributes. All variables are rescaled to run from 0-1, so effect sizes are on that scale. The darkened circles give point estimates, while vertical lines show 95% confidence intervals. The analysis pools across co-ethnicity; that is, mean responses of subjects assigned to the “co-ethnic, non-cousin” or “non-coethnic, non-cousin” conditions are subtracted from the mean responses of subjects assigned to the “co-ethnic cousin” or “not-coethnic cousin” conditions.
Treatment effects, in sum • Both co-ethnicity and cousinage alliances make evaluations of the politician more positive—but cousins from a different ethnic group are just as attractive as non-cousins from voters’ own ethnic group • That is, evaluations of co-ethnic non-cousins and non-coethnic cousins are statistically indistinguishable • Estimated treatment effects are similar for similar questions (such as, “on a scale of 1 to 7, how would you rate the global quality of this speech”)? • Trustworthiness and credibility appear to play an important role • So may social networks: voters in both the cousin and the co-ethnic conditions report having more friends and acquaintances with the politician’s last name
External validity concerns • External validity concerns are very central here • One narrow sense of external validity: is the experimental study group representative of the broader population? • On ethnicity, apparently • On gender, not at all • This is a concern: our results are valid for the experimental study group but are they for the broader population? • On the other hand, treatment effects are very similar for men and for women (we also use sampling weights, with caveats, to construct estimates for the broader population) • But can the experimental results explain the real-world puzzle? • The issue of “variance explained”
Can the Experimental Evidence Explain the Observational Data? Three Important Points • Cousinage relations are politically (and not just culturally or socially) salient • Treatment effects are much stronger for politically-active subjects • Candidates exploit cousinage relations in campaigns • Cousinage relations are widespread • The probability that a politician and a voter drawn at random are cousins matches or exceeds the probability that they are co-ethnics • E.g., for a Keita, the probability that a voter drawn at random is a co-ethnic is about 0.15; the probability that s/he is a cousin is about 0.52 • Co-ethnic and cousinage ties are negatively associated • E.g., among eligible subjects who are not ethnically Malinké, an ethnic Malinké named Keita is most likely to be a cousin, while among Malinkés, a Keita is most likely to be a non-cousin • Voters prefer co-ethnics; but an unobserved omitted variable attenuates the observed correlation between co-ethnicity and candidate preferences
Other results (see paper!) • We also test the observable implications for party strategy • Parties appear to exploit cousinage networks in placing candidates on lists • We use Afrobarometer data and surnames of candidates in the 2007 parliamentary elections to evaluate this • Note that it is useful to combine observational and experimental data in this regard – particularly, to link the experimental results to real-world outcomes and (partially) address concerns about external validity
Example 2: Combining Field and Natural Experiments to Strengthen Causal Inference • Several recent papers combine field and natural experiments or merge true experiments at different levels of analysis • Beaman et al. 2008, Fearon et al. 2009 • Such approaches can be quite useful for measuring the causal impact of institutions • Here I present research on how electoral quotas shape the salience of caste in India • I use a field experimental design similar to the design in Mali – but embed the field experiment in a natural experiment, in which caste quotas for the presidencies of village councils are “as-if” randomly assigned
The Salience of Ethnic Categories • Political leadership and electoral rules may shape the salience of different forms of ethnic identification • In India, presidencies of some village councils are reserved, via an electoral quota, for presidents from lower-caste groups • Such quotas may increase the salience of the larger caste category on which reservation is based, at the expense of the individual sub-castes that comprise the category • Yet estimating causal effects is difficult, if reservation is related to observed or unobserved characteristics of council constituencies
Measuring the Effect of Reservation: A Regression-Discontinuity Design • Reservation of council presidencies rotates across village councils on the basis of population proportions of the targeted groups • I exploited an RD design to construct a study group of 160 councils, located in the state of Karnataka, in which reservation is plausibly assigned as-if at random • The main advantage: we can attach causal interpretations to post-reservation differences across reserved and unreserved councils • The procedure also produces a study group of council constituencies in which the population proportion of the targeted groups varies greatly, which may help with external validity
Measuring Caste-Based Preferences: A Field Experiment • In the 160 selected villages, I then implemented a field experiment in which I manipulated the perceived caste relationship between subjects and a videotaped actor/political candidate (by changing the surname of the politician) • Subjects were assigned at random to one of three conditions: • Subject and politician share the same sub-caste, same larger category • Subject and politician from different sub-castes but the same larger category • Subject and politician are from different larger categories • The identity of the actor and the text of the speech were identical across conditions (with a few caveats) • I can then compare subjects’ evaluations of the politician (including vote preference) across treatments; and I can compare treatment effects across reserved and unreserved council constituencies
Caste categories in Karnataka • The structure of caste in Karnataka raises interesting questions about the salience of ethnic categories • Two main jatis comprise the Scheduled Castes • The Holaya and the Madiga are former Untouchable sub-castes (Harijans), with some history of antagonism and competition • There are two dominant jatis among the Backward Castes • The Vokkaliga and Lingayath sub-castes tend to dominate politics at the local and state level • So what dimension of caste is most important to voters? • E.g., Holaya/Madiga or Scheduled Caste? • Vokkaliga/Lingayath or Backward Caste (anti-SC)? • And what shapes the relative salience of these categories?
Reservation: The system of rotation • Reservation for lower-caste politicians of the council presidencies has been assigned as follows, starting with the 1994 elections: • In each taluk (an administrative unit below the district), the number N of presidencies to be reserved for each group (Scheduled Caste or Scheduled Tribe) is determined by each group’s population proportion in the taluk as a whole • To allocate reservation to particular panchayats, a bureaucrat lists panchayats in descending order by the number of council seats reserved each relevant group; the number of reserved seats is determined by the proportion of each group in the panchayat population • Then, starting with the Scheduled Caste category, the bureaucrat moves down the list of panchayats, reserving the first N presidencies • The same is then done for Scheduled Tribes; the remaining Gram Panchayats are reserved for two groups of Backward Castes (A and B) or left for the General category • Within a bin (defined by the number of reserved seats), if there are more councils than presidencies to be reserved, reservation is allocated by lottery • In the next election, the bureaucrat takes up where he or she left off, rotating reservation to the next N villages on the list, for each respective category • If, in any election, a Gram Panchayat is already reserved for one category (e.g., Scheduled Caste) but appears in among the GPs that should be reserved for andother category (e.g., Scheduled Tribe), the panchayat is skipped and then reserved for the latter category in the subsequent election
Verifying the assignment procedure • I obtained reservation data for the entire state of Karnataka for each presidential term (1994, 2000, 2002, 2005, 2007) • This allows me to verify that the selection procedure was actually employed • Bureaucrats are required by state regulations to hold meetings at the taluk level, where the identity of reserved councils are announced and the criteria for allocation are explained • This should increase the transparency of the process and limit the potential for lobbying • Fieldwork confirms that at least some of these meetings were held
Village selection: a regression-discontinuity design • I mimicked the process of reservation as closely as possible, using census data on group proportions (the same data used by the bureaucrats) • By listing panchayats in descending order of population proportion for each group, and using reservation data, one can find the threshold points: that is, the cut-point between panchayats in each category that were reserved and those that were not • The idea of the regression-discontinuity design is to select councils on either side of, and nearest to, the threshold. Observed and unobserved variables should be very nearly balanced—and assignment to reservation thus may be plausibly “as-if” random near the threshold • Local independence is bolstered in Karnataka because many panchayats with similar group proportions will have the same number of seats reserved for members—and then reservation of the presidency is assigned via a lottery • One hiccup is that I used the underlying populations proportions (sigh), whereas bureaucrats used the number of members’ seats; though the latter are based on the underlying proportions, larger panchayats will on average be higher on the list • However, this should not bias inferences, since councils just above and below my thresholds should have similar populations, on average
Reservation: as-if randomization checks Mean male population, mean male population age 0-6, mean number of marginal workers, and other pre-treatment covariates are omitted but also pass the covariate balance test. P-value for assignment covariates is 0.97 (SC proportion) and 0.26 (mean ST proportion).
Design of the field experiment • I filmed an actor delivering two versions of a political speech (in Kannada) • During recruitment and prior to random assignment, subjects revealed their jati and several other attributes on a screening questionnaire • Subjects were shown one of the two (identical) speeches • In the introduction to the video and in every follow-up question, field investigators varied the surname of the candidate, according to the treatment assigned
Experimental Design Same caste category Different caste category Same sub-caste (jati) Different sub-caste (jati)
Politician’s surname by treatment condition (Selected sub-castes*) * Omitted subject sub-castes include Lambani (SC), Kumbara (BC), and Bunt (BC)
Stimulus: The political speech • There were two versions of the political speechone “programmatic” and the other “clientelistic with the version to be shown assigned at random • The programmatic speech focused on general needs and local public goods • The clientelistic speech focused on jobs, schemes, income and caste certificates, and other targeted benefits • The content of the speech appears to have had relatively little impact on candidate evaluations • In the analysis, I pool across the two versions of the speech…
Subject recruitment • A stratified random sample of ten respondents per village: • Four SC residents (ideally, two Holaya and two Madiga) • One ST resident (Nayaka) • Five residents from the general category (including Backward Castes) • Some limited substitution of jatis was allowed • Residential segregation in villages eased the sampling • Twenty teams of two field investigators visited 10 villages (on average) • Thus, 200 villages, with 2000 participants • 40 villages were set aside for a pilot study, leaving 160 villages and 1600 subjects (in principle) for this experiment • In each village, surveys were also taken of the council president, two council members, and the executive secretary (more later)
Weaknesses of the experimental design • As in Mali, estimated treatment effects may not be large, for a number of reasons • Stimulus is somewhat artificial? • May not prime caste effectively? • Issues with surnames… • In the field experiment, we may therefore expect to estimate lower-bounds on the effects of caste • However, the design is likely to give us a good sense of how reservation shifts the relative salience of caste categories
Chart gives average answers to the question, “On a scale of 1 to 7, how much does this speech make you want to vote for (name of candidate)?” Jati refers to Vokkaliga, Lingayath, Holaya, Madiga, etc. Caste category refers to SC, ST, OBC, and so on.
The relevance of sub-caste • The effects of sharing a sub-caste on candidate evaluations are statistically significant, relative to the other two treatments • In the experimental population as a whole, politicians from a different sub-caste, but the same caste category, are statistically indistinguishable from politicians from a different caste category • This finding holds for sub-groups, in particular, for both Scheduled Castes and dominant Backward Castes • The estimated effect of treatment assignment is about one-quarter of one standard deviation • This is in the neighborhood of, but somewhat smaller than, the estimated effects of co-ethnicity in an experiment in Mali
Treatment effects, in sum • Many variables may help explain the preference for politicians from the same sub-caste, relative to different caste categories • On the other hand, only the benefits variable significantly distinguishes among sub-castes, within the same caste category • Politicians from another sub-caste but the same category are significantly preferred to politicians from a different caste category only on credibility grounds • Does reservation of the council presidency shape the relative salience of different caste relationships?
Chart gives average answers to the question, “On a scale of 1 to 7, how much does this speech make you want to vote for (name of candidate)?” “Reserved panchayat” means, reserved for SC or ST adhyaksha. “Unreserved panchayat” means, reserved for OBC or General category.
The variable measuring “credibility” combines survey questions about the post-election performance of the politician: whether he is trustworthy, has good motives for running for office, could face the challenges of office, would do a good job if elected, and would fight for others and defend his ideals once in office. The variable is scaled to run from 0 to 1.
The variable measuring “benefits” combines answers to the following two survey questions: “If (name of the politician) were elected, people like you would receive more benefits from the welfare schemes of the government” and “If (name of the politician) were elected, people like you would have a better chance of getting a job with the government.” The variable is scaled to run from 0 to 1.