Download
1 / 56
580 likes | 825 Views
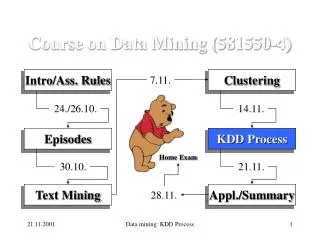
Data Mining and Knowledge Discovery in Databases (KDD) State of the Art. Prof. Dr. T. Nouri Computer Science Department FHNW Switzerland. Conference overview. Overview of KDD and data mining Data mining techniques Demo Summary. User. Shell. System-Engineer. Knowledge Base.

E N D
Data Mining and Knowledge Discovery in Databases (KDD)State of the Art Prof. Dr. T. Nouri Computer Science Department FHNW Switzerland
Conference overview • Overview of KDD and data mining • Data mining techniques • Demo • Summary
User Shell System-Engineer Knowledge Base User Interface Knowledge Engineer Explication Knowledge Extraction Inference Data/Expert Knowledge-Based System Data Mining
Overview of data mining • What is KDD? • Why is KDD necessary • The KDD process • KDD operations and methods
What is data mining? • The iterative and interactive process of discovering valid, novel, useful, and understandable knowledge ( patterns, models, rules etc.) in Massive databases
What is data mining? • Valid: generalize to the future • Novel: what we don't know • Useful: be able to take some action • Understandable: leading to insight • Iterative: takes multiple passes • Interactive: human in the loop
Why data mining? • Data volume too large for classical analysis • Number of records too large (millions or billions) • High dimensional (attributes/features/ fields) data (thousands) • Increased opportunity for access • Web navigation, on-line collections
Data mining goals • Prediction • What? Opaque • Description • Why? Transparent
Data mining operations • Verification driven • Validating hypothesis • Querying and reporting (spreadsheets, pivot tables) • Multidimensional analysis (dimensional summaries); On Line Analytical Processing • Statistical analysis
Data mining operations • Discovery driven • Exploratory data analysis • Predictive modeling • Database segmentation • Link analysis • Deviation detection
Data mining process Interpretation Data Mining Transformation Preprocessing Knowledge Selection Patterns Transformed Data Preprocessed Data Target Data Original Data
Data mining process • Understand application domain • Prior knowledge, user goals • Create target dataset • Select data, focus on subsets • Data cleaning and transformation • Remove noise, outliers, missing values • Select features, reduce dimensions
Data mining process • Apply data mining algorithm • Associations, sequences, classification, clustering, etc. • Interpret, evaluate and visualize patterns • What's new and interesting? • Iterate if needed • Manage discovered knowledge • Close the loop
Data mining process Create/select target database Original DB Select sample Normalize values Eliminate noisy data Supply missing values Transform values Create derived attributes Relevant attributes Select DM method (s) Select DM task (s) Extract knowledge Test knowledge Refine knowledge Presentation, visualization
Related fields • AI • Machine learning • Statistics • Databases and data warehousing • High performance computing • Visualization
Need for data mining tools • Human analysis breaks down with volume and dimensionality • How quickly can one digest 1 million records, with 100 attributes • High rate of growth, changing sources • What is done by non-statisticians? • Select a few fields and fit simple models or attempt to visualize
Conference overview • Overview of KDD and data mining • Data mining techniques • Demo • Summary • KDD resources pointers
Data mining methods • Predictive modeling (classification, regression) • Segmentation (clustering) • Dependency modeling (graphical models, density estimation) • Summarization (associations) • Change and deviation detection
Data mining techniques • Association rules: detect sets of attributes that frequently co-occur, and rules among them, e.g. 90% of the people who buy cookies, also buy milk (60% of all grocery shoppers buy both) • Sequence mining (categorical): discover sequences of events that commonly occur together, .e.g. In a set of DNA sequences ACGTC is followed by GTCA after a gap of 9, with 30% probability
Data mining techniques • CBR or Similarity search: given a database of objects, and a “query” object, find the object(s) that are within a user-defined distance of the queried object, or find all pairs within some distance of each other. • Deviation detection: find the record(s) that is (are) the most different from the other records, i.e., find all outliers. These may be thrown away as noise or may be the “interesting” ones.
Data mining techniques • Classification and regression: assign a new data record to one of several predefined categories or classes. Regression deals with predicting real-valued fields. Also called supervised learning. • Clustering: partition the dataset into subsets or groups such that elements of a group share a common set of properties, with high within group similarity and small inter-group similarity. Also called unsupervised learning.
Data mining techniques • Many other methods, such as • Decision trees • Neural networks • Genetic algorithms • Hidden markov models • Time series • Bayesian networks • Soft computing: rough and fuzzy sets
Research challenges for KDD • Scalability • Efficient and sufficient sampling • In-memory vs. disk-based processing • High performance computing • Automation • Ease of use • Using prior knowledge
Types of data mining tasks • General descriptive knowledge • Summarizations • symbolic descriptions of subsets • Discriminative knowledge • Distinguish between K classes • Accurate classification (also black box) • Separate spaces
Components of DM methods • Representation: language for patterns/models, expressive power • Evaluation: scoring methods for deciding what is a good fit of model to data • Search: method for enumerating patterns/models
Data mining techniques • Association rules • Sequence mining • Classification(decision tree etc.) • Clustering • Deviation detection • K-nearest neighbors
What is association mining? • Given a set of items/attributes, and a set of objects containing a subset of the items • Find rules: if I1 then I2 (sup, conf) • I1, I2 are sets of items • I1, I2 have sufficient support: P(I1+I2) • Rule has sufficient confidence: P(I2|I1)
What is association mining? • Ex: • If A and B then C • If A and not B then C • If A and B and C then D etc.
Support & Confidence Support is defined as the minimum percentage of transactions in the DB containing A and B. Confidence is defined as the minimum percentage of those transactions containing A that also contain B. Ex. Suppose the DB contains 1 million transactions andt that 10‘000 of those transactions contain both A and B. We can then say that the support of the association if A then B is: S= 10‘000/1‘000‘000 = 1%. Likewise, if 50‘000 of the transactions contain A and 10‘000 out of those 50‘000 also contain B then the association rule if A then B has a confidence 10‘000/50‘000 = 20%. Confidence is just the conditional probability of B given A.
Support & Confidence R: LS RS Supp(R)=supp(LS RS) = #Transaction verifying R / (Total # of Transaction) Conf(R)= supp(LS RS)/supp(LS) Ex: R: Milk=> cookies, A support(R) of 0.8 means in 80% of transaktion Milk and cookies are together. The confidence means the correlation, the relation between the LS and the RS.
Association Mining ex. Farine Sucre has a confidence of 100%, this is the force of the association and a support of 2/3. number of association farine => Sucre divided by number of ticket where sucre or farine exist.
TransaktionID PassagierID Ziel 431 102 New York 431 102 London 431 102 Cairo 431 102 Paris 701 38 New York 701 38 London 701 38 Cairo 11 531 New York 11 531 Cairo 301 102 New York 301 102 London 301 102 Paris What is association mining?
What is Support and what is Confidence? Having the following Rule: Rule:Who visit New York, visit London too.<==> New York=>London. Calculate the support the Support and the Confidence of this Rule.
What is sequence mining? • Given a set of items, list of events per sequence ordered in time • Find rules: if S1 then S2 (sup, conf) • S1, S2 are sequences of items • S1, S2 have sufficient support: P(S1+S2) • Rule has sufficient confidence: P(S2|S1)
Sequence mining • User specifies “interestingness” • Minimum support (minsup) • Minimum confidence (minconf) • Find all frequent sequences (> minsup) • Exponential Search Space • Computation and I/O Intensive • Generate strong rules (> minconf) • Relatively cheap
Predictive modeling • A “black box” that makes predictions about the future based on information from the past and present • Large number of input available Model Age High/Low Risk Salary CarType
Models • Some models are better than others • Accuracy • Understandability • Models range from easy to understand to incomprehensible • Decision trees • Rule induction • Regression models • Neural networks Easier Harder
What is Classification? Classification is the process of assigning new objects to predefined categories or classes • Given a set of labeled records • Build a model (decision tree) • Predict labels for future unlabeled records
Classification learning • Supervised learning (labels known) • Example described in terms of attributes • Categorical (unordered symbolic values) • Numeric (integers, reals) • Class (output/predicted attribute): categorical for classification, numeric for regression
Decision-tree classification Age < 27.5 CarType {Sports} High High Low Age=40, CarType=Family Class=Low Numeric Categorical
From tree to rules Age < 27.5 1) Age < 27.5 High 2) Age >= 27.5 and CarType = Sports High 3) Age >= 27.5 and CarType Sports Low CarType {Sports} High High Low
What is clustering? Given N k-dimensional feature vectors , find a “meaningful” partition of the N examples into c subsets or groups • Discover the “labels” automatically • c may be given, or “discovered” • much more difficult than classification, since in the latter the groups are given, and we seek a compact description
Clustering • Have to define some notion of “similarity” between examples • Goal: maximize intra-cluster similarity and minimize inter-cluster similarity • Feature vector be • All numeric (well defined distances) • All categorical or mixed (harder to define similarity; geometric notions don’t work)
Clustering schemes • Distance-based • Numeric • Euclidean distance (root of sum of squared differences along each dimension) • Angle between two vectors • Categorical • Number of common features (categorical) • Partition-based • Enumerate partitions and score each
K-means algorithm Initial seeds
K-means algorithm New centers
K-means algorithm Final centers
Deviation detection outlier
K-nearest neighbors • Classification technique to assign a class to a new example • Find k-nearest neighbors, i.e., most similar points in the dataset (compare against all points!) • Assign the new case to the same class to which most of its neighbors belong
K-nearest neighbors Neighborhood 5 of class 3 of class =