Download
1 / 27
280 likes | 415 Views
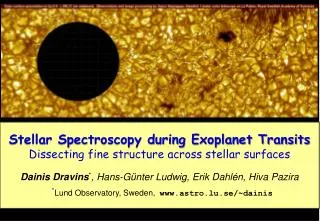
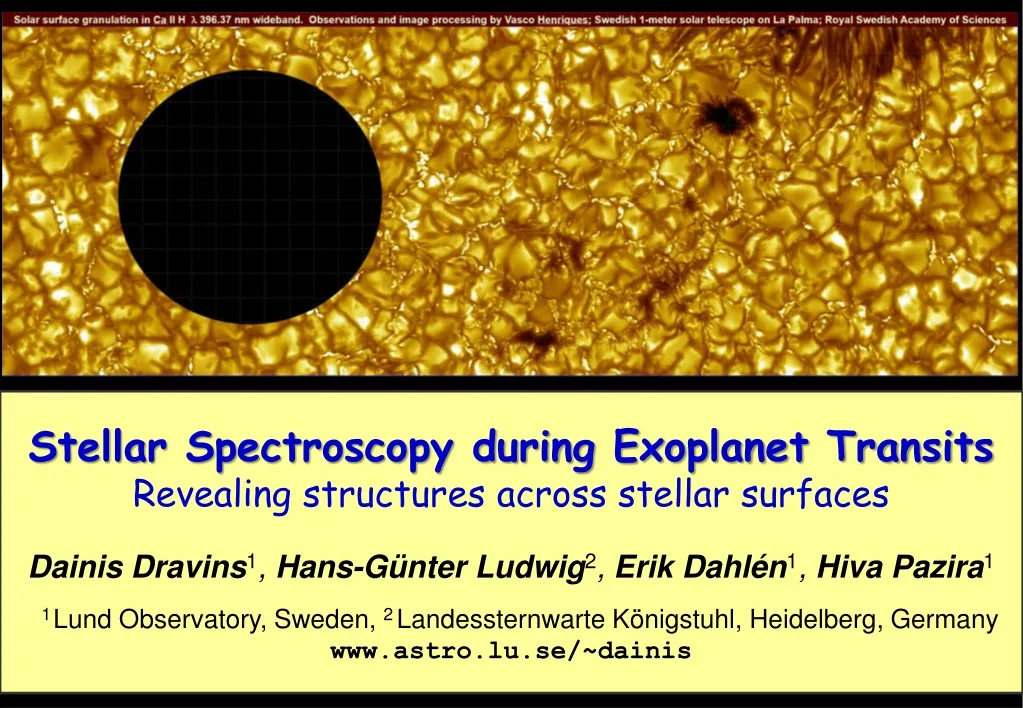
KVA. Stellar Spectroscopy during Exoplanet Transits Revealing structures across stellar surfaces Dainis Dravins 1 , Hans-Günter Ludwig 2 , Erik Dahlén 1 , Hiva Pazira 1 1 Lund Observatory, Sweden, 2 Landessternwarte Königstuhl , Heidelberg, Germany www.astro.lu.se/~dainis.

E N D
KVA Stellar Spectroscopy during Exoplanet Transits Revealing structures across stellar surfaces Dainis Dravins1, Hans-Günter Ludwig2, Erik Dahlén1, Hiva Pazira1 1Lund Observatory, Sweden, 2LandessternwarteKönigstuhl, Heidelberg, Germany www.astro.lu.se/~dainis
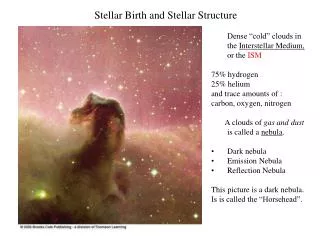
AN ”IDEAL” STAR ? Very quiet solar disk (GONG/Teide)
A REAL STAR ! Granulation near the limb (towards the top) at 488 nm; Swedish 1-m solar telescope, La Palma
MODELING STELLAR SURFACES –White dwarf vs. Red giant Snapshots of emergent intensity during granular evolution on a 12,000 K white dwarf (left) and a 3,800 K red giant. Horizontal areas differ by dozen orders of magnitude: 7x7 km2 for the white dwarf, and 23x23 RSun2 for the giant. (H.-G. Ludwi,g, Heidelberg)
What future stellar astrophysics? Stellar abundances accurate to ±0.01 dex? Differential chemistry in stars with or without planets? Accurate stellar oscillations? Stellar sizes seem not consistent if deduced from naïve models. Stellar differential rotation? Stellar gas dynamics are deduced from subtle signatures of line profiles. Magnetic and chromospheric activity? How do magnetic fields affect stellar convection? Exoplanet signatures? Exoplanet properties are deduced differentially to the stellar spectrum. Precision stellar physics requires 3-D modeling But simulations are complex. How can one verify such models?
How to verify or falsify 3-D models?
Line profiles from 3-D Hydrodynamic simulations Model predictions insensitive to modest spatial smearing Spatially averaged line profiles from 20 timesteps, and temporal averages. = 620 nm = 3 eV 5 line strengths GIANT STAR Teff= 5000 K log g [cgs] = 2.5 (approx. K0 III) Stellar disk center; µ = cos = 1.0 (Models by Hans-Günter Ludwig, Landessternwarte Heidelberg)
Line profiles from 3-D Hydrodynamic simulations Model predictions insensitive to modest spatial smearing Spatially and temporally averaged line profiles. = 620 nm = 1, 3, 5 eV 5 line strengths GIANT STAR Teff= 5000 K log g [cgs] = 2.5 (approx. K0 III) Stellar disk center; µ = cos = 1.0 (Models by Hans-Günter Ludwig, Landessternwarte Heidelberg)
Line profiles from 3-D Hydrodynamic simulations Model predictions insensitive to modest spatial smearing SUN Profiles from CO5BOLD solar model; Five line strengths; excitation potentials = 1, 3, 5 eV. Left: Solar disk center µ = cos = 1. Right: Off-center disk position µ = cos = 0.59. (Models by Hans-Günter Ludwig, Landessternwarte Heidelberg)
Simulated intensities approaching the solar limb Mats Carlsson, Oslo; in Å.Nordlund, R.F.Stein, M.Asplund: Solar Surface Convection, Liv.Rev.Solar Phys. 6, 2
Spectral line profiles across stellar disks Spectral lines, spatially and temporally averaged from 3-D models, change their strengths, widths, asymmetries and convective wavelength shifts across stellar disks, revealing details of atmospheric structure. These line profiles from disk center (µ = cos = 1) towards the limb are from a CO5BOLD model of a main-sequence star; solar metallicity, Teff = 6800 K. (Models by Hans-Günter Ludwig, Landessternwarte Heidelberg)
Spatially resolving stellar surfaces Hiva Pazira, MSc thesis, Lund Observatory (2012)
Stellar Spectroscopy during Exoplanet Transits * Exoplanets successively hide segments of stellar disk * Differential spectroscopy provides spectra of those surface segments that were hidden behind the planet * 3-D hydrodynamics studied in center-to-limb variations of line shapes, asymmetries and wavelength shifts * With sufficient S/N, also spectra of surface features such as starspots may become attainable
Exoplanet transit geometry G.Torres, J.Winn, M.J.Holman: Improved Parameters for Extrasolar Transiting Planets, ApJ 677, 1324
HD 209458 Promising star for spatially resolved spectroscopy Spectral type: G0 V, Apparent magnitude mV= 7.65 Teff = 6100 K, log g [cgs] = 4.50, [Fe/H] = 0 Vrot 4.5 km/s; slow rotator, comparable to Sun sin i = 1 if the star rotates in same plane as transiting planet Sufficiently similar to Sun for same spectral identifications. Somewhat hotter, lines somewhat weaker, less blending. Large planet: Bloated hot Jupiter, R = 1.38 RJup. More vigorous convection for line differences to be detectable?
Spectrum of HD209458 very similar to solar Detailed similarities between the spectrum of the G0 V star HD209458 and the well-studied solar spectrum enable numerous line identifications
Challenge of extremely high S/N * Retrieving good spectra from behind exoplanet covering 1% of star, requires S/N10,000 !! * Transit time short: Largest telescopes required * High wavelength stability desired but loses light * High spectral resolution desired but loses light * Single spectral lines insufficient: Need averages
HD 209458 extensively observed Several observatory archives searched (ESO/VLT/UVES, ESO/3.6m/HARPS, Keck/HIRES, SUBARU/HDS, etc.) Data used here originate from one ESO/VLT/UVES program: Program ID: 077.C-0379(A), “A POWERFUL NEW METHOD TO PROBE THE ATMOSPHERE OF EXOPLANET HD209458B” PI/COI: SNELLEN/ COLLIER CAMERON/ HORNE Observing date: 14.08.2006 UVES spectrometer slitwidth 0.50 arcsec Spectral resolution 60,000 Maximum S/N = 480
Averaging many ‘similar’ photospheric lines 26 Fe I ‘similar’ photospheric lines in HD 209458 Their average ‘synthesizes’ a representative profile (ESO/VLT/UVES/REDL)
Changes in representative profile during transit 14 successive exposures during [part of] exoplanet transit Line profile is average of 26 Fe I photospheric lines
Simulated line changes during exoplanet transit Line profile changes during exoplanet transit. Red: Ratios of line profiles relative to the profile outside transit. This simulation sequence from a CO5BOLD model predicts the behavior of an Fe I line ( 620 nm, = 3 eV) during the first half of a transit across the stellar equator by a bloated Jupiter-size exoplanet moving in a prograde orbit, covering 2% of a main-sequence star with solar metallicity, Teff = 6300 K, rotating with Vsini = 5 km/s.
Retrieving spatially resolved stellar line profiles
Stellar Spectroscopy during Exoplanet Transits * Now: Marginally feasible with, e.g., UVES @ VLT * Immediate future: PEPSI @ LBT * Near future: ESPRESSO @ VLT * Future: HIRES @ E-ELT ? Anytime soon: More exoplanets transiting bright stars