Download
1 / 28
280 likes | 398 Views
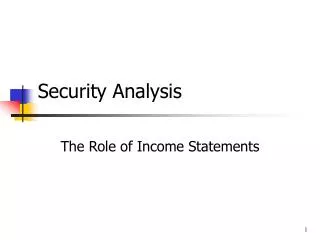
Security Analysis. Financial Statements Balance Sheet. Income Statement . Revenues - Cost of Goods Gross Income - Operating Expenses Operating Income -Financing Expenses - Taxes

E N D
Security Analysis Financial Statements Balance Sheet
Income Statement Revenues -Cost of Goods Gross Income -Operating Expenses Operating Income -Financing Expenses -Taxes Net Income Before Extraordinary Items +/- Extraordinary Profits/(Losses) Preferred Dividends Net Common Income to Shareholders
Principles • Accrual Accounting • Categorization of Expenses into 1. Operating Expenses 2. Financing Expenses 3. Capital Expenditures
Warning Signs • EPS Growing Faster than Revenue Year after Year • Frequent Acquisitions or One Time Charges • Rapid Growth in Working Capital • Changes in Inventory/Depreciation Methods • Change in Auditors
Balance Sheet What is it and What can Investors Use it For?
Statement of Financial Position as of a Specific Date Assets Liabilities and Equity Cash Accounts Payable Accts Receivable Accrued Expenses Inventory Current Debt Prepaid Expenses Taxes Payable Current Assets Current Liabilities Other Assets Long Term Debt Fixed Assets Retained Earnings Net Fixed Assets Shareholders Equity Total Assets Total Liabilities & Equity ==================================
Uses of the Balance Sheet • Assess Risk • Identify Value • Understand Competitive Advantage
Info in the Balance Sheet • Division of Capital Between Senior Obligations and Common Equity • Strength or Weakness of Working Capital Position • Reconciliation of Earnings reported in income statement
Info on the Balance Sheet • Data for Analyzing Relationship between Earnings Power and Asset Values. (Fixed/Variable Costs) • Data to Test True Business Success (ROIC)
Impact of Debt • Magnifies Returns (Positive AND Negative) • Adds Fixed Costs • Adds Uncertainty
How Much Debt is Enough? • Versus Business Model • Versus Peers • Working Capital
Historic Value of Book Value • Originally Represented Value of Private Business (Tangible Assets) • Today Little Relation to Market Value for Many Companies • Intangibles as Valuable as Plant • Useful to Corroborate Income Statement • Still Relevant in Energy, Financials, Distressed
Value of Firm Going Concern Value Liquidation Value Going Concern Value Relationship of Going Concern ValueAnd Liquidation Value
Value of Firm Going Concern Value Liquidation Value Going Concern Value Relationship of Going Concern ValueAnd Liquidation Value
Balance Sheet Can Discern Efficiency Trends • Cash Cycle: Time it Takes to Turn Raw Materials into Cash • Day in Inventory+Days Receivable-Days Payable • Fast is Good!
Dell 1/05 HPQ 10/04 Earnings 3,043 3,497 Interest Exp 0 225 Assets 23,215 76,138 Shareholders’ Equity 6,485 37,564 ROA 13.1% 4.9% ROE 46.9% 9.3% Update on Dell/HPQ
Dell HPQ ROE 59.1% 8.08% P/B 15.53 2.15 “Return on Mkt Cap” 3.81% 3.77% P/E 26.4 25.5 P/B = Price/Equity ROE = NI/Equity ROE x 1/(P/B) = return on market cap = (NI/Equity x (1/(price/equity) Figures are per Yahoo Finance 9-05-05 Accounting Ratios/Stock Price: Dell/HPQ
Balance Sheet Manipulation • Leases: Operating versus Capital • Pension Assets • Special Purpose entities
Ratio Analysis: Combining IS and BS • Liquidity: Current Ratio, Working Capital to Sales Ratio • Asset Management: Inventory Turns, Asset Turns, Days Receivable • Profitability: Gross Margin, Operating Margin, ROA, ROE • Leverage Ratios: Debt to Capitalization
For Company Selection • Calculate Liquidity, Asset, Profitability, and Leverage Ratios for your selected company and its comparable companies over each of the 5 years • LOOK at them. THINK about them • Identify likely areas of required accounting adjustments
Ratios • Current Ratio= Current Assets/Current Liabilities • Working Capital Ratio= Working Capital/Sales • Inventory Turns=Cost of Goods Sold/Inventory • Asset Turns=Sales/Assets • Receivable Days=Receivables/Sales x 365 • Return on Assets=Net Income*/Total Assets • Return on Equity=Net Inc/Shareholders Equity • Return on Sales=Net Inc/Net Sales • Gross Margin= (Sales-Cost of Gds Sold)/Sales • Operating Margin=Operating Income/Sales • Debt/Capital=Long Term Debt/Long Term Debt+Shrhldrs Equity *Some add back interest on debt
What is in the 10k and What can We Learn? Item 1: Business Model and Strategy Industry Trends/ Comparisons 2. Properties: Sources of Capacity and Revenues. Exposure to currency and variation in cost levels 3. Legal Proceedings: Potential Liquidity issues 4. Matters Requiring Shareholder Vote. Potential material change in business (M&A) 5. Stock Performance, Listings, Float, Dividend 6. Selected Financial Data: Snapshot of data deemed important by management. One time items
What is in the 10k and What can We Learn? 7. Management Discussion. Analysis of past financial performance and future outlook. Strength and weakness in business operations and funding issues. Supplement to data in notes. 7a. Market Risk: Laundry list of risks and competition 8. Financial Statements and Supplementary Data (notes). Indications for future sustainability and quality of earnings/Profitability 9. Changes and Disagreements w/Accountants. Potential red flags regarding quality of disclosure and financial performance.
What is in the 10k and What can We Learn? 10. Directors/Officers and Conflicts 11. Executive Compensation 12. Ownership of Stock. Executives and certain beneficial owners 13. Related Party Transactions/Conflicts 14. Exhibits, Statement Schedules. More info providing insight (subjective accruals). New contracts. Off balance sheet entities. Changes in Bank covenants.