Download
1 / 7
70 likes | 169 Views
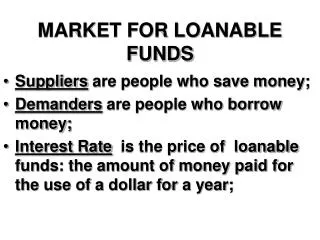
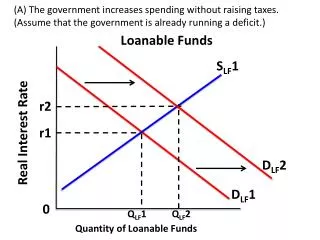
Loanable Funds market Framework. This framework is particularly useful for predicting interest rate. changes due to events in the country or the world.

E N D
Loanable Funds market Framework • This framework is particularly useful for predicting interest rate changes due to events in the country or the world . The analysis is conducted in terms of the price of money– interest rates– directly. No extra step is needed to relate the price of bonds (inversely) to the interest rate. GO to next
Step 2: What is the PRICE of the thing? Step 3: Who DEMANDS it? borrowers LIST all the factors that affect demand:expected income,expected inflation, gov’t deficit... interest rate they’d want less Step 4: From this initial i&Q, if the interest rate increased, would borrowers want more or less?... Draw and label the axis Note that DLFby borrowers = SB label it 5. DLFby borrowers Step 5: connect those two points with the DEMAND curve QLF Step 1: What is the thing?loanable funds Draw and LABEL the axis go to next
Step 6: Who supplies it? savers List factors that affect supply:wealth, relative expected returns, relative risk, relative liquidity, expected inflation... i LABEL IT: Step 8. SLF by savers they’d save more Note that SLF by savers = DBONDS Step 8:draw the supply curve Step 7:from an initial i,Q; if i increased, would savers provide less, or more...? DLFby borrowers (=SBONDS) QLF go to next
i SLF by savers io Step 9:identify the initial equilibrium interest rate (and quantity) DLFby borrowers QLF Qo go to next
Step 10. How does the event affect the factors of demand and supply? Example Event: What will happen to interest rates if people expect inflation to rise? DLF = f ( i; eGDP, gov’t deficit, e) = SBONDS DEMAND:if borrowers expect inflation to rise (later), they would rather buy more stuff now (to expand capacity, or whatever) so they would BORROW MORE NOW. DLF increases (= SBONDS increases). SLF = f ( i; W, eRETB/eREToth, B/oth, lB/loth, e) = DBONDS SUPPLY: if savers expect inflation to rise (later), they would rather buy more stuff now, so they would SAVE LESS NOW. SLF decreases (=DBONDS decreases). Now illustrate these effects on your graph, go to next
Step 12.illustrate change (if any) inSupply i SLF by savers i1 SLF decreases io DLF increases DLFby borrowers Step 11.illustrate change (if any) inDemand Step 13.identify the new equilibrium i QLF Qo go to next
Step 14.SUMMARIZE: If people expect inflation to rise, savers will supply fewer loans, because they would rather buy stuff now while prices are low. Borrowers will demand more loans so they can expand capacity and sell more stuff later when prices are higher. Interest rates will rise. i SLF by savers i1 io DLFby borrowers QLF note: the change in the equilibrium quantity of loanable funds is not important in the analysis of interest rates. back to Kilkenny’s 353 web page start over