Download
1 / 1
10 likes | 85 Views
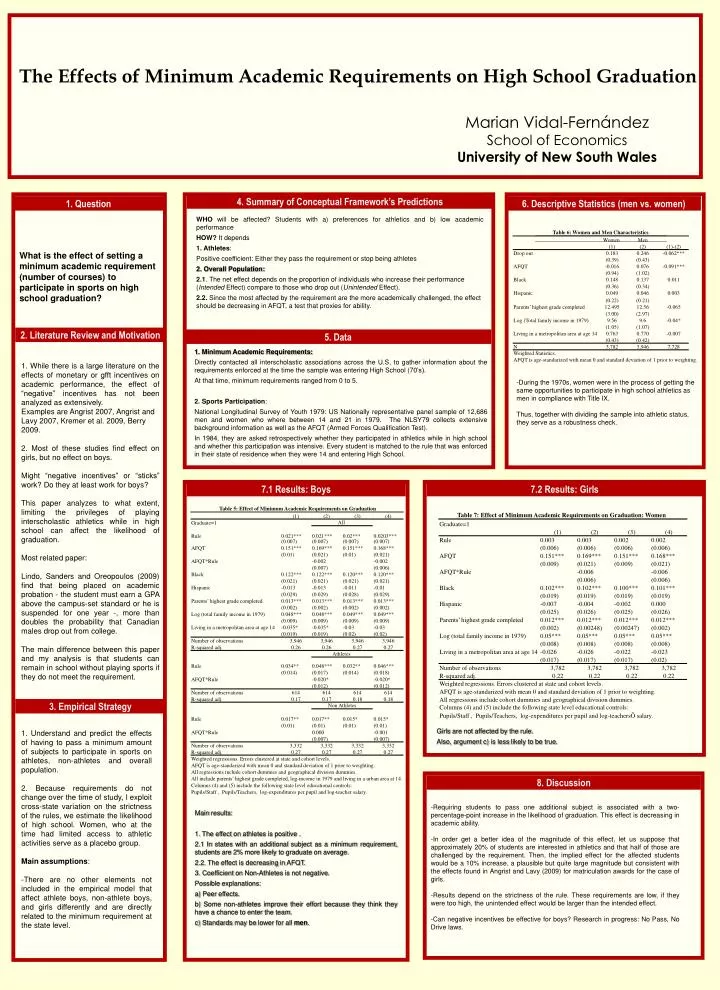
Table 6: Women and Men Characteristics. Women. Men. (1). (2). (1)-(2). Drop out. 0.183. 0.246. -0.062***. (0.39). (0.43). AFQT. -0.016. 0.076. -0.091***. (0.94). (1.02). Black. 0.148. 0.137. 0.011. (0.36). (0.34). Hispanic. 0.049. 0.046. 0.003. (0.22). (0.21).

E N D
Table 6: Women and Men Characteristics Women Men (1) (2) (1)-(2) Drop out 0.183 0.246 -0.062*** (0.39) (0.43) AFQT -0.016 0.076 -0.091*** (0.94) (1.02) Black 0.148 0.137 0.011 (0.36) (0.34) Hispanic 0.049 0.046 0.003 (0.22) (0.21) Parents’ highest grade completed 12.495 12.56 -0.065 (3.00) (2.97) Log (Total family income in 1979) 9.56 9.6 -0.04* (1.05) (1.07) Living in a metropolitan area at age 14 0.763 0.770 -0.007 (0.43) (0.42) N 3,782 3,946 7,728 Weighted Statistics. AFQT is age-standarized with mean 0 and standard deviation of 1 prior to weighting. Table 5: Effect of Minimum Academic Requirements on Graduation Table 7: Effect of Minimum Academic Requirements on Graduation: Women (1) (2) (3) (4) All Graduate=1 Graduate=1 (1) (2) (3) (4) Rule 0.021*** 0.021*** 0.02*** 0.0203*** Rule 0.003 0.003 0.002 0.002 (0.007) (0.007) (0.007) (0.007) (0.006) (0.006) (0.006) (0.006) AFQT 0.151*** 0.169*** 0.151*** 0.168*** (0.01) (0.021) (0.01) (0.021) AFQT 0.151*** 0.169*** 0.151*** 0.168*** AFQT*Rule -0.002 -0.002 (0.009) (0.021) (0.009) (0.021) (0.007) (0.006) AFQT*Rule -0.006 -0.006 Black 0.122*** 0.122*** 0.120*** 0.120*** (0.006) (0.006) (0.021) (0.021) (0.021) (0.021) Hispanic -0.013 -0.013 -0.011 -0.01 Black 0.102*** 0.102*** 0.100*** 0.101*** (0.029) (0.029) (0.028) (0.029) (0.019) (0.019) (0.019) (0.019) Parents’ highest grade completed 0.013*** 0.013*** 0.013*** 0.013*** Hispanic -0.007 -0.004 -0.002 0.000 (0.002) (0.002) (0.002) (0.002) (0.025) (0.026) (0.025) (0.026) Log (total family income in 1979) 0.048*** 0.048*** 0.049*** 0.049*** Parents’ highest grade completed 0.012*** 0.012*** 0.012*** 0.012*** (0.009) (0.009) (0.009) (0.009) Living in a metropolitan area at age 14 -0.035* -0.035* -0.03 -0.03 (0.002) (0.00248) (0.00247) (0.002) (0.019) (0.019) (0.02) (0.02) Log (total family income in 1979) 0.05*** 0.05*** 0.05*** 0.05*** Number of observations 3,946 3,946 3,946 3,946 (0.008) (0.008) (0.008) (0.008) R-squared adj. 0.26 0.26 0.27 0.27 Living in a metropolitan area at age 14 -0.026 -0.026 -0.022 -0.023 Athletes (0.017) (0.017) (0.017) (0.02) Rule 0.034** 0.048*** 0.032** 0.046*** Number of observations 3,782 3,782 3,782 3,782 (0.014) (0.017) (0.014) (0.018) R-squared adj. 0.22 0.22 0.22 0.22 AFQT*Rule -0.020* -0.020* Weighted regressions. Errors clustered at state and cohort levels. (0.012) (0.012) Number of observations 614 614 614 614 AFQT is age-standarized with mean 0 and standard deviation of 1 prior to weighting. R-squared adj. 0.17 0.17 0.18 0.18 All regressions include cohort dummies and geographical division dummies. Non Athletes Columns (4) and (5) include the following state level educational controls: Pupils/Staff , Pupils/Teachers, log-expenditures per pupil and log-teachersÕ salary. Rule 0.017** 0.017** 0.015* 0.015* (0.01) (0.01) (0.01) (0.01) AFQT*Rule 0.000 -0.001 (0.007) (0.007) Number of observations 3,332 3,332 3,332 3,332 R-squared adj. 0.27 0.27 0.27 0.27 Weighted regressions. Errors clustered at state and cohort levels. AFQT is age-standarized with mean 0 and standard deviation of 1 prior to weighting. All regressions include cohort dummies and geographical division dummies. All include parents’ highest grade completed, log-income in 1979 and living in a urban area at 14. Columns (4) and (5) include the following state level educational controls: Pupils/Staff , Pupils/Teachers, log-expenditures per pupil and log-teacher salary. The Effects of Minimum Academic Requirements on High School Graduation Marian Vidal-Fernández School of Economics University of New South Wales 4. Summary of Conceptual Framework’s Predictions 1. Question 6. Descriptive Statistics (men vs. women) WHO will be affected? Students with a) preferences for athletics and b) low academic performance HOW? It depends 1. Athletes: Positive coefficient: Either they pass the requirement or stop being athletes 2. Overall Population: 2.1. The net effect depends on the proportion of individuals who increase their performance (Intended Effect) compare to those who drop out (Unintended Effect). 2.2. Since the most affected by the requirement are the more academically challenged, the effect should be decreasing in AFQT, a test that proxies for ability. What is the effect of setting a minimum academic requirement (number of courses) to participate in sports on high school graduation? 2. Literature Review and Motivation 5. Data 1. Minimum Academic Requirements: Directly contacted all interscholastic associations across the U.S, to gather information about the requirements enforced at the time the sample was entering High School (70’s). At that time, minimum requirements ranged from 0 to 5. 2. Sports Participation: National Longitudinal Survey of Youth 1979: US Nationally representative panel sample of 12,686 men and women who where between 14 and 21 in 1979. The NLSY79 collects extensive background information as well as the AFQT (Armed Forces Qualification Test). In 1984, they are asked retrospectively whether they participated in athletics while in high school and whether this participation was intensive. Every student is matched to the rule that was enforced in their state of residence when they were 14 and entering High School. 1. While there is a large literature on the effects of monetary or gfft incentives on academic performance, the effect of “negative” incentives has not been analyzed as extensively. Examples are Angrist 2007, Angrist and Lavy 2007, Kremer et al. 2009, Berry 2009. 2. Most of these studies find effect on girls, but no effect on boys. Might “negative incentives” or “sticks” work? Do they at least work for boys? This paper analyzes to what extent, limiting the privileges of playing interscholastic athletics while in high school can affect the likelihood of graduation. Most related paper: Lindo, Sanders and Oreopoulos (2009) find that being placed on academic probation - the student must earn a GPA above the campus-set standard or he is suspended for one year -, more than doubles the probability that Canadian males drop out from college. The main difference between this paper and my analysis is that students can remain in school without playing sports if they do not meet the requirement. -During the 1970s, women were in the process of getting the same opportunities to participate in high school athletics as men in compliance with Title IX. Thus, together with dividing the sample into athletic status, they serve as a robustness check. 7.1 Results: Boys 7.2 Results: Girls 3. Empirical Strategy Girls are not affected by the rule. Also, argument c) is less likely to be true. 1. Understand and predict the effects of having to pass a minimum amount of subjects to participate in sports on athletes, non-athletes and overall population. 2. Because requirements do not change over the time of study, I exploit cross-state variation on the strictness of the rules, we estimate the likelihood of high school. Women, who at the time had limited access to athletic activities serve as a placebo group. Main assumptions: -There are no other elements not included in the empirical model that affect athlete boys, non-athlete boys, and girls differently and are directly related to the minimum requirement at the state level. 8. Discussion -Requiring students to pass one additional subject is associated with a two-percentage-point increase in the likelihood of graduation. This effect is decreasing in academic ability. -In order get a better idea of the magnitude of this effect, let us suppose that approximately 20% of students are interested in athletics and that half of those are challenged by the requirement. Then, the implied effect for the affected students would be a 10% increase, a plausible but quite large magnitude but consistent with the effects found in Angrist and Lavy (2009) for matriculation awards for the case of girls. -Results depend on the strictness of the rule. These requirements are low, if they were too high, the unintended effect would be larger than the intended effect. -Can negative incentives be effective for boys? Research in progress: No Pass, No Drive laws. Main results: 1. The effect on athletes is positive . 2.1 In states with an additional subject as a minimum requirement, students are 2% more likely to graduate on average. 2.2. The effect is decreasing in AFQT. 3. Coefficient on Non-Athletes is not negative. Possible explanations: a) Peer effects. b) Some non-athletes improve their effort because they think they have a chance to enter the team. c) Standards may be lower for all men.