Download
1 / 33
360 likes | 573 Views
CHAPTER 3 Analysis of Financial Statements. Ratio analysis Du Pont system Effects of improving ratios Limitations of ratio analysis Qualitative factors. Balance Sheet: Assets. 2002E. 2001. Cash. 85,632. 7,282. AR. 878,000. 632,160. Inventories. 1,716,480. 1,287,360. Total CA.

E N D
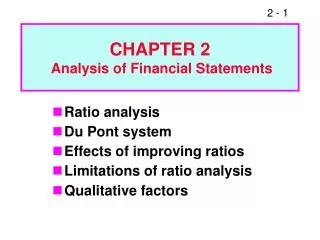
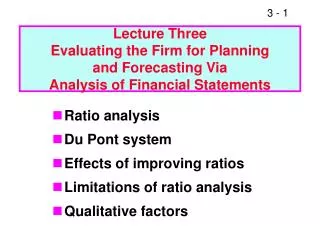
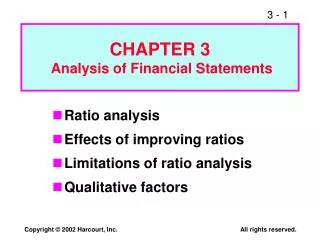
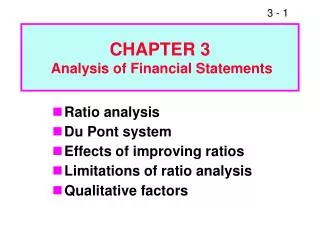
CHAPTER 3 Analysis of Financial Statements • Ratio analysis • Du Pont system • Effects of improving ratios • Limitations of ratio analysis • Qualitative factors
Balance Sheet: Assets 2002E 2001 Cash 85,632 7,282 AR 878,000 632,160 Inventories 1,716,480 1,287,360 Total CA 2,680,112 1,926,802 Gross FA 1,197,160 1,202,950 Less: Deprec. 380,120 263,160 Net FA 817,040 939,790 Total assets 3,497,152 2,866,592
Liabilities and Equity 2002E 2001 Accounts payable 436,800 524,160 Notes payable 300,000 636,808 Accruals 408,000 489,600 Total CL 1,144,800 1,650,568 Long-term debt 400,000 723,432 Common stock 1,721,176 460,000 Retained earnings 231,176 32,592 Total equity 1,952,352 492,592 Total L & E 3,497,152 2,866,592
Income Statement 2002E 2001 Sales 7,035,600 6,034,000 COGS 5,875,992 5,528,000 Other expenses 550,000 519,988 609,608 (13,988) EBITDA 116,960 116,960 Depreciation EBIT 492,648 (130,948) Interest exp. 70,008 136,012 EBT 422,640 (266,960) Taxes (40%) 169,056 (106,784) Net income 253,584 (160,176)
Other Data 2002E 2001 Shares out. 250,000 100,000 EPS $1.014 ($1.602) DPS $0.220 $0.110 Stock price $12.17 $2.25 Lease pmts $40,000 $40,000
Why are ratios useful? • Standardize numbers; facilitate comparisons • Used to highlight weaknesses and strengths
What are the five major categories of ratios, and what questions do they answer? • Liquidity: Can we make required payments? • Asset management: Right amount of assets vs. sales?
Debt management: Right mix of debt and equity? • Profitability: Do sales prices exceed unit costs, and are sales high enough as reflected in PM, ROE, and ROA? • Market value: Do investors like what they see as reflected in P/E and M/B ratios?
Calculate D’Leon’s forecasted current and quick ratios for 2002. $2,680 $1,145 CA CL CR02 = = = 2.34x. CA - Inv. CL QR02 = $2,680 – $1,716 $1,145 = = 0.84x.
Comments on CR and QR 2002 2001 2000 Ind. CR 2.34x 1.2x 2.3x 2.7x QR 0.84x 0.4x 0.8x 1.0x • Expected to improve but still below the industry average. • Liquidity position is weak.
Sales Inventories Inv. turnover = = = 4.10x. $7,036 $1,716 2002 2001 2000 Ind. Inv. T. 4.1x 4.7x 4.8x 6.1x What is the inventory turnover ratio vs. the industry average?
Comments on Inventory Turnover • Inventory turnover is below industry average. • D’Leon might have old inventory, or its control might be poor. • No improvement is currently forecasted.
DSO is the average number of days after making a sale before receiving cash. Receivables Average sales per day DSO = = = = 45.6. Receivables Sales/365 $878 $7,036/365
Appraisal of DSO 2002 2001 2000 Ind. DSO 45.6 38.2 37.4 32.0 • D’Leon collects too slowly, and is getting worse. • D’Leon has a poor credit policy.
Fixed assets turnover Sales Net fixed assets = = = 8.61x. $7,036 $817 Total assets turnover Sales Total assets = = = 2.01x. $7,036 $3,497 F.A. and T.A. Turnover versus Industry Average
2002 2001 2000 Ind. FA TO 8.6x 6.4x 10.0x 7.0x TA TO 2.0x 2.1x 2.3x 2.6x • FA turnover projected to exceed industry average. Good. • TA turnover not up to industry average. Caused by excessive current assets (A/R and Inv.)
Calculate the debt ratio, TIE, and EBITDA coverage ratios. Total debt Total assets Debt ratio = = = 44.2%. $1,145 + $400 $3,497 EBIT Int. expense TIE = = = 7.0x. $492.6 $70
EBITDA coverage = EBITDA + Lease payments (in cash) Interest Lease Principal expense pmt. repayments = = 5.9x. + + $609.6 + $40 $70 + $40 + $0
How do the debt management ratios compare with industry averages? 2002 2001 2000 Ind. D/A 44.2% 82.8% 54.8% 50.0% TIE 7.0x -1.0x 4.3x 6.2x EBITDA coverage 5.9x 0.1x 3.0x 8.0x D/A and TIE are better than industry average but EBITDA still below industry average.
NI Sales $253.6 $7,036 P.M. = = = 3.6%. Profit margin vs. industry average? 2002 2001 2000 Ind. P.M. 3.6% -2.7% 2.6% 3.5% Very bad in 2001, but projected to exceed industry average in 2002. Looking good.
BEP vs. industry average? EBIT Total assets BEP = = = 14.1%. $492.6 $3,497
2002 2001 2000 Ind. BEP 14.1% -4.6% 13.0% 19.1% • BEP removes effect of taxes and financial leverage. Useful for comparison. • Projected to be below average. • Room for improvement.
Return on Assets Net income Total assets ROA = = = 7.3%. $253.6 $3,497
Net income Common equity ROE = = = 13.0%. $253.6 $1,952 2002 2001 2000 Ind. ROA 7.3% -5.6% 6.0% 9.1% ROE 13.0% -32.5% 13.3% 18.2% Both below average but improving.
Effects of Debt on ROA and ROE • ROA is lowered by debt--interest lowers NI, which also lowers ROA = NI/Assets. • But use of debt lowers equity, hence could raise ROE = NI/Equity.
Typical Industry Average P/E Ratios IndustryP/E ratio Banking 16.58 Computer Software Services 84.28 Drug 43.89 Electric Utilities (Eastern U.S.) 25.28 Internet Services* 326.53 Semiconductors 85.44 Steel 12.38 Tobacco 11.07 Water Utilities 22.30 * Because many internet companies have negative earnings and no P/E, there was only a small sample of internet companies.
NI + Depr. Shares out. CF per share = = = $1.48. $253.6 + $117.0 250 Price per share Cash flow per share P/CF = = = 8.21x. $12.17 $1.48
Com. equity Shares out. BVPS = = = $7.81. $1,952 250 Mkt. price per share Book value per share M/B = = = 1.56x. $12.17 $7.81
2002 2001 2000 Ind. P/E 12.0x -1.4x 9.7x 14.2x P/CF 8.21x -5.2x 8.0x 11.0x M/B 1.56x 0.5x 1.3x 2.4x • P/E: How much investors will pay for $1 of earnings. High is good. • P/CF: How much investors will pay for $1 of cash flow. High is good. • M/B: How much paid for $1 of BV. Higher is better. • P/E and M/B are high if ROE is high, risk is low.
Potential use of freed up cash • Repurchase stock • Expand business • Reduce debt • All these actions would improve stock price.
What are some potential problems and limitations of financial ratio analysis? • Comparison with industry averages is difficult if the firm operates many different divisions. • “Average” performance not necessarily good. • Seasonal factors can distort ratios.
“Window dressing” techniques can make statements and ratios look better. • Different operating and accounting practices distort comparisons. • Sometimes hard to tell if a ratio is “good” or “bad.” • Difficult to tell whether company is, on balance, in strong or weak position.
What are some qualitative factors analysts should consider when evaluating a company’s likely future financial performance? • Are the company’s revenues tied to 1 key customer, product, or supplier? • What percentage of the company’s business is generated overseas? • Competition • Future prospects • Legal and regulatory environment