Download
1 / 53
540 likes | 700 Views
Introduction to the Oscilloscope Professor Ahmadi ECE 002. OBJECTIVES. Lab Safety Review Electrical Signals – Quick Overview Explain Common Lab Equipment – Oscilloscope, Function Generator, etc.

E N D
OBJECTIVES • Lab Safety Review • Electrical Signals – Quick Overview • Explain Common Lab Equipment– Oscilloscope, Function Generator, etc. • Learn how to use an Oscilloscope to:– Measure D.C. (Direct Current) Voltage– Measure A.C. (Alternating Current) Voltage
Lab Safety • No Food or Drinks • Use Common Sense • In Case of Emergency– If electrical, turn off the main circuit breaker – Call UDP at 4-6111– Notify the staff in Room 304
Example Electrical Signal • Above, this sine wave represents a voltage that is changing over time • So at time=2.5s, what is the voltage? – And again at10seconds?...15seconds? • We can see that as time moves forward, the voltage is changing • – Is this an AC or DC voltage? What does that mean?
The Theory... • Why do we need an oscilloscope?
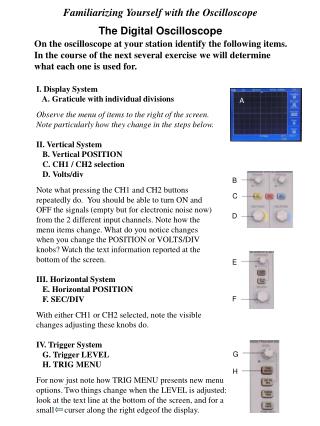
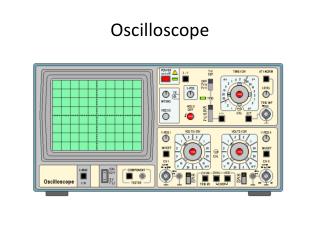
What are the major components? • Display Screen • Displays an input signal with respect to time. • Control Panel • Adjusts how the input signal is displayed.
What is the purpose of an oscilloscope • The purpose of an oscilloscope is to measure a voltage that changes with time and show it in a graphical format 1) Here is the oscilloscope in our lab -Notice the X-Y axes 2) Here is our alternating voltage signal from before 3) If we measure our signal with the scope, it would look like this!
What do we now know about the scope? • What must the X-Axis represent? • What must the Y-Axis represent?
Oscilloscope: Screen • Notice that the screen has ruled divisions both horizontally and vertically. • The axes can be scaled, for example... • If each vertical division is worth 5 seconds, what time is represented by this point? • If each horizontal line represents 1 volt, what voltage is represented by this point?
Oscilloscope: Control Panel • The section to the right of the screen contains the controls necessary to adjust how the waveform is displayed on the screen. • The controls allow you to alter the sweep time, amplitude, and triggering method. (Note, these topics will be discussed later)
Oscilloscope: Input Channels • How do we get the voltage into the scope? • This area is broken into four parts –for channel 1 to 4 respectively • Connect the cable to the number you would like to serve as the input to the scope: 1, 2, 3 or 4. • Why would we want more than 1 channel?
The Setup... • In this section, we will power on the oscilloscope and set it up to display a signal connected to the CH1 input.
Simple Signals We Can Measure • Is this signal changing over time? What do we call this type of signal? If we made a chart at the different time intervals...
Turning on the Oscilloscope • Press the POWER button located below the bottom left corner of the Oscilloscope’s screen. • Set the Channel Mode to CH1. • Set the Trigger Mode. • A green line or dot should appear on the screen. • If not, try adjusting the Intensity or Position dials.
Cables • We will use three types of connecters in this lab. • BNC • Banana • Mini-Grabber George Washington University
Making Your First Connection • Obtain a BNC cable, Mini-Grabber attachment and connection them together. • Connect the free end of the BNC cable to CH1 on the oscilloscope
Time Per Division Dial • Find the Time/Div dial on the oscilloscope. This dial controls the amount of time per centimeter division. • Adjust to dial to 2 milliseconds per centimeter.
Horizontal Position • Adjust the Position dial for Channel 1 to center the horizontal line.
Adjusting the Display • If the display is difficult or out of focus, you can press the DISPLAY button to adjust the intensity and focus. • The INTENSITY controls the brightness of the line. • The FOCUS dial controls the sharpness of the line. • Take a moment to adjust each one and notice the difference.
At this point... • The channel mode should be set to 1. • The TIME/DIV should be set to 2mS per centimeter. • A BNC cable should be connected to the channel 1 input. The other end should have a free Mini-Grabber connection. • The Oscilloscope should be ON. • The intensity and focus should be adjusted so the line is clear to see. • The channel 1 position dial should be adjusted so that the green line is centered on the screen.
Measuring a DC signal • In this section, we will use an external DC POWER SUPPLY to create a DC signal to measure with the oscilloscope
Measuring a Direct Current Voltage • Set the VOLTS/DIV to 1 by adjusting the yellow dial corresponding to channel 1 . • When you turn right the VOLTS/DIV increases. • When you turn left the VOLTS?DIV decreases.
Setting Up the DC Power Supply • This DC Power supply is capable of generating voltages from -25V to 25V. • For this lab, we will be using the 6V supply terminals. • First, press the Power Button to turn it on. George Washington University
Setting Up the DC Power Supply • Press Output On/Off once to turn on the output. • Press the +6V button to tell the power supply that we want to alter the output from the 6V terminals. • Once done, your screen should look the same as it does on this slide. George Washington University
Setting Up the DC Power Supply • The dial on the right hand side is used to increase and decrease the output value. • The arrows under the dial are used to determine which digit is affected by the dial. George Washington University
Setting Up the DC Power Supply Press this arrow to Select the desired digit • Press the left arrow until the digit to the left of the decimal point is blinking. • Use the dial to increase the display value to 3 volts as shown. • Note: You can safely ignore the value of the right most digit for this experiment. This is the digit we want to adjust Rotate this dial to alter the output value. George Washington University
Setting Up the Power Supply • Now it is time to connect the DC Power Supply to the Oscilloscope. • Locate Mini-Grabber connectors on the other end of the cable that was previously attached to the Oscilloscope. • Attach the connecters to the DC Power Supply as shown. • Note: You may need to partially unscrew the terminal knobs before connecting the Mini-Grabbers. George Washington University
Observing the DC Output • Once connected, the line on the Oscilloscope display will move up three divisions. • At 1Volt/Division, this equals 3 Volts. • Adjust the DC Power Supply output and the Volts/Division dial and observe the changes. George Washington University
Important Observations at This Point • Volts/Division Dial • It does not change the voltage. • It is a sensitivity dial that allows us to measure a wide range of voltages by indicating how many volts are represented by each division. George Washington University
Finishing Up the DC Measurements • Go ahead and… • Turn off the DC Power Supply • Disconnect the Mini-Grabbers George Washington University
Measuring an AC signal In this section, we will use the built-in FUNCTION GENERATOR to create an AC signal to measure with the oscilloscope George Washington University
Measuring a Time Varying (A.C.) Voltage • Now look at the function generator. • This device produces a voltage that varies over time. • In the upcoming slides we will exam each of the controls that allow us to shape the output. George Washington University
Function Generator Controls: Wave Shape • An important part of a function generator is the shape of the wave it creates. • This function generator can produce a • Square Wave • Triangle Wave • Sine Wave • Pulse Wave • Arbitrary Wave • Under Function, push the Sine button to set the output as a sine wave. The button should light up green. • (Note: The Oscilloscope must be on in order to change the this option.) George Washington University
Function Generator Controls: Frequency Range • This generator allows you to change the frequency (Cycles per Second) of the output wave. • First, press the Frequency/Period button. The frequency selection should now be highlighted on the display. • Then, turn the dial until it reaches 1 kHz. Use the arrows for digit control. • Turning the dial clockwise (CW) will increase the output frequency and counter-clockwise (CCW) will decrease it. • Press the ON button to output the signal. George Washington University
Function Generator Controls 5 Volts Peak-to-Peak 2 Volts Peak-to-Peak 2.5 Volt Amplitude 1 Volt Amplitude Not only can we change the shape and frequency of a wave, but we can also change the amplitude. George Washington University
Function Generator Controls: Amplitude • Just like for controlling frequency, press the Amplitude button until it lights green. • The Amplitude selection should now be highlighted on the display. • Turn the dial as previously, CW to increase and CCW to decrease. • The same applies for the Offset button. Amplitude DC-Offset George Washington University
Making the Connection • Locate the Function Generator’s Output. • Using a B.N.C. Cable, Connect the Function Generator’s Output to the CH1 Input. George Washington University
Making the Connection • Set the Volts/Division to 2. Turn the dial CCW to increase and CW to decrease. • Use the Position dial to raise or lower the image until it is centered on the screen. George Washington University
Making the Connection • The Time/Division dial corresponds to the amount of time in each division along the X-direction. Turn CCW to increase and CW to decrease. • Set this dial to 0.5ms. • With 10 divisions per screen, what is the total time span represented? George Washington University
Triggering • Now we need to tell the scope when to display the signal. • Electric signals change much faster than we can observe, so we must tell the Oscilloscope when to refresh the display. • We accomplish this by setting a Triggering Level. George Washington University
Triggering Without Triggering With Triggering George Washington University
Going up! Triggering • We want to tell the oscilliscope when it is the best time for it to “refresh” the display • In our wave below, we tell the scope to “trigger” or ‘capture’ the signal when it is going upward AND hits 2.0Volts SO, ‘trigger’ condition is: When we’re AND When at 2.0 Volts on our waveform! George Washington University
Triggering: Setup Remember, channel 1 is where our waveform is coming from! • If it isn’t already, set the Trigger Source to CH1. The active channel should be lit green. • Push the Trigger knob to auto set. • In some cases, this is enough to produce a clear output, but often we will need to adjust the Trigger Level. • If the output is unstable, turn the triggering knob until it stabilizes. Think of the “Level” as being WHERE on the waveform to trigger, like in our last slide, at 2.0 Volts! George Washington University
Measuring the Voltage • Using the CH1 Position Dial, move the wave until the bottom lines up with one of the division lines. • Measure the number of divisions from the bottom to the top. At 2 Volts Per Division, This wave has an amplitude of 5V. Peak to Peak Voltage = (Volts/Division) *(# of Division) Amplitude = (1/2) * Peak to Peak Voltage George Washington University
Measuring the Frequency • Position to wave so that the beginning lines up with one of the vertical division markers. • Count the number of divisions until the beginning of the next wave. With 0.5ms/division, this wave has a frequency of 1kHz Period = (Time/Division) *(# of Division) Frequency = 1/Period George Washington University
Mixing It Up • Increase the Volts/Division Dial to 5. • Decrease the Time/Division Dial to 0.2ms. • Recalculate the • Peak to Peak Voltage • Amplitude • Period • Frequency • How do these results compare to the ones you previously measured? Note: If the signal becomes unstable, you may need to readjust the triggering level. George Washington University
Changing the Frequency Generator • Now, change the amplitude on the frequency generator. • Note that wave’s height grows and shrinks as this dial is adjusted. • Next, try changing the frequency and the shape of the wave. • Remember that the Volts/Division, Time/Division and Triggering Level may need to be adjusted. George Washington University
Summary: Measuring A.C. Voltage • Turn on the Oscilloscope. • Use the function generator to set the shape, frequency and amplitude of the desired output wave. • Connect the generator’s output to the channel 1 input of the oscilloscope. • Approximate the Time/Division and Volts/Division. • Use the Position Dial to center the wave on the screen. George Washington University
Summary: Measuring AC Voltage • Set the Triggering Source to CH1. • Set the Triggering Mode to Auto. • Adjust the Triggering Level until the output wave stabilizes. • Adjust the Volts/Division and Time/Division dials until the desired output is produced. • If needed, use the Focus and Intensity Dials to sharpen the picture displayed. George Washington University
Your turn… In this section, you are put to the test! George Washington University