Download
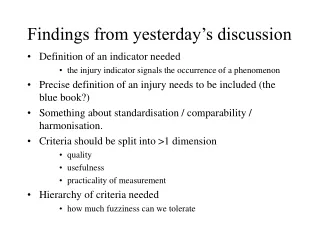
1 / 17
170 likes | 292 Views
Nonprofits increase voting Findings from 2012. Presented by. &. Participation gaps. Over half of all eligible voters were not contacted by a campaign in 2012. Source: American National Election Studies, 2008 and 2012 Survey of Political Involvement and Participation in Politics.

E N D
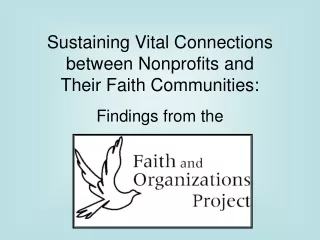
Nonprofits increase votingFindings from 2012 Presented by &
Participation gaps Over half of all eligible voters were not contacted by a campaign in 2012. Source: American National Election Studies, 2008 and 2012 Survey of Political Involvement and Participation in Politics
A role for Nonprofits • Access and Trust: Nonprofits have unique access to underrepresented populations • Reverse Door knocking: People “knock” on our doors for services.
The study • Partners in 7 states: Recruited participants • 94 nonprofits: Community health centers, multi-service agencies and other service providers • 33,741 voters: Tracked face-to-face voter engagement with voters at their agency
Tracking the Nonprofit Voters • Registrations and Pledges: People were asked to register to vote or sign a pledge to vote • Matching to Voter File: Nonprofit Voters matched to voter file for demographics/turnout • State VAN (voter file): matching • Catalist: analysis
Nonprofit Voters a Diverse Group Nonprofit Voters were a much more diverse group of registered voters than registered voters in the general population. Quant
Nonprofit voters had high turnout Nonprofit Voters outperformed their counterparts in the general population by 6 points.
By race and ethnicity Latino and Asian American Nonprofit Voters out- performed their counterparts by 18 points.
Closing voter turnout gaps Nonprofit Voters turned out at comparable rates with only small disparities by race or ethnicity.
By Income Lower income Nonprofit Voters outperformed their counterparts by as much as 15 points.
By Age Young Nonprofit Voters under age 30 outperformed their counterparts by 15 points.
Propensity To Vote • Catalist assigns individuals a propensity to vote score on a scale of 0-100. • Campaigns focus mobilization on individuals with a propensity between 30 and 70. • Individuals with lower propensity scores are frequently neglected.
By Propensity Very low propensity Nonprofit Voters turned out a rate 3 times that of their counterparts.
conclusions • Higher Turnout: Voters contacted by a nonprofit where they receive services turned out at higher rates than the general population. • Less Disparities: Turnout by Nonprofit Voters was more consistent across all demographics of race, income, and age. • Greater reach: Nonprofits reach and turnout voters campaigns don’t contact.
info@nonprofitvote.org 617.357.VOTE (8683) www.nonprofitvote.org Nonprofit VOTE 89 South Street Suite 203 Boston, MA 02111 George Pillsbury gpillsbury@nonprofitvote.org Kei Kawashima-Ginsberg kei.kawashima_ginsberg@tufts.edu