Download
1 / 34
340 likes | 406 Views
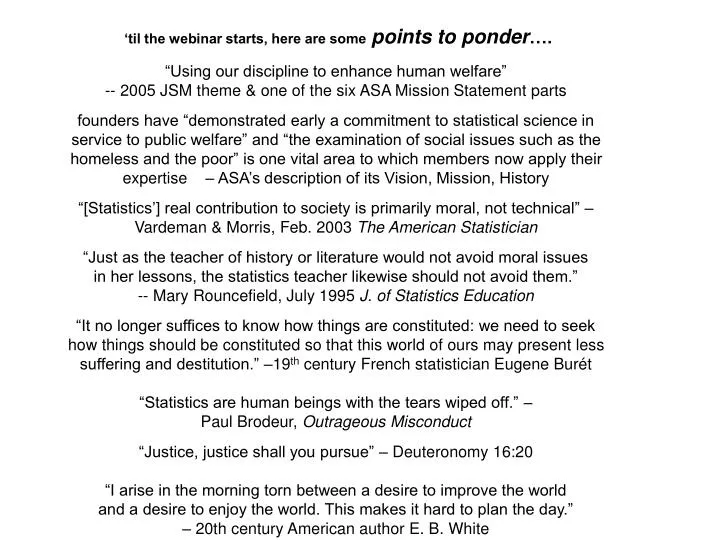
“Using our discipline to enhance human welfare” -- 2005 JSM theme & one of the six ASA Mission Statement parts

E N D
“Using our discipline to enhance human welfare” -- 2005 JSM theme & one of the six ASA Mission Statement parts founders have “demonstrated early a commitment to statistical science in service to public welfare” and “the examination of social issues such as the homeless and the poor” is one vital area to which members now apply their expertise – ASA’s description of its Vision, Mission, History “[Statistics’] real contribution to society is primarily moral, not technical” – Vardeman & Morris, Feb. 2003 The American Statistician “Just as the teacher of history or literature would not avoid moral issues in her lessons, the statistics teacher likewise should not avoid them.” -- Mary Rouncefield, July 1995 J. of Statistics Education “It no longer suffices to know how things are constituted: we need to seek how things should be constituted so that this world of ours may present less suffering and destitution.” –19th century French statistician Eugene Burét “Statistics are human beings with the tears wiped off.” – Paul Brodeur, Outrageous Misconduct “Justice, justice shall you pursue” – Deuteronomy 16:20 “I arise in the morning torn between a desire to improve the world and a desire to enjoy the world. This makes it hard to plan the day.” – 20th century American author E. B. White ‘til the webinar starts, here are somepoints to ponder….
Logistics Reminder Until the “discussion” part, you’ll be “muted” (for optimal audio quality), but you can relay questions via your “chat window.” This webinar will be archived (www.causeweb.org/webinar/) & its main associated article is also accessible online (www.amstat.org/publications/jse/v15n1/).
Welcome to our July 10, 2007 CAUSE Webinar:“Teaching Statistics Using Social Justice Examples” Drawing from (and expanding upon) my article in J. of Statistics Education (March 2007), we’ll discuss examples, resources and pedagogy associated with this meaningful way of engaging students in the statistics classroom. Dr. Larry Lesser, Assoc. Professor University of Texas at El Paso www.math.utep.edu/Faculty/lesser/
TSSJ = “Teaching Statistics with Social Justice” the teaching of statistics with nontrivial inclusion of examples related to SJ, offering chances for students to reflect upon the context of these examples as they learn or apply associated statistical content (Lesser 2007)
OUTLINE “Presentation” portion • Background & Terms • Examples & Resources • Pedagogy & Implementation “Discussion” portion Feedback -- when prompted with a feedback window at the end of the webinar
Quick Feedback #1 Click “RAISE HAND” if: you read the JSE article
If you did read it, this webinar will give you some things beyond it. If you haven’t read it, it’s a recommended place to start: it includes definitional issues, content examples, some 150 references/resources, and concise literature review of the broader pedagogical and philosophical realms.
Quick Feedback #2 Now click “RAISE HAND” if: you have classroom (or research) experience with the topic of this webinar, whether or not you read the JSE article
My Background/Trajectory • 2000-01: created math/stat/ethics module at AASU (published in Nov. 2004 JSE) • 2002-04: full-time teaching at a HS where students had 18-hr/year service requirement and did many projects to support its mission to “provide a lifelong foundation for…improving the world in which we live” • 2004: began teaching at UT-El Paso
Background (continued) 2005: JSM paper on SJ/ethics/service learning; Gutstein’s work inspires me to write SJ paper for JSE 2006: chapter in critical pedagogy book; a major speaker at 1st national college-level course development workshop on Math and SJ; 2007: SJ paper appears in JSE (March); 1st national conference on Math & SJ (May); MSJ2 workshop (June); CAUSE webinar (July)
a progression towards TSSJ • “social justice” (SJ) • “teaching for SJ” • “teaching mathematics for SJ”
Searching • Google: “SJ” – millions “T for SJ” – tens of thousands “TM for SJ” – hundreds TSSJ – 0 (excluding this year’s webinar & JSE paper) • CAUSEWeb: “SJ” – 0
Viewing statistics as “the grammar of SJ”? (Lesser 2007) Tools to identify group differences or patterns can help people recognize, analyze or address social inequalities Calculating expected value of a “fair share” and how much deviation might be viewed as innocuous offers a benchmark to discussions about what is “fair.” An awareness of statistical pitfalls helps people interpret or make appropriate depictions of quantitative information.
a progression towards TSSJ • “social justice” (SJ) • “teaching for SJ” • “teaching mathematics for SJ” ---------------------------------- • “teaching statistics for SJ” • “teaching statistics with SJ”
SJ & stats: goodness of fit “Using our discipline to enhance human welfare” -- theme of 2005 JSM and one of the six parts of the ASA Mission Statement founders have “demonstrated early a commitment to statistical science in service to public welfare” and “the examination of social issues such as the homeless and the poor” is one vital area to which members now apply their expertise – ASA’s description of its Vision, Mission, History
Another reason: motivation! “few are drawn to statistics by immediate practical need.... today's teachers face challenges of motivation… substantially greater than those of a half-century ago.” (GAISE; ASA 2005) Emerging evidence suggests that TSSJ examples support student engagement (Gutstein 2003, Makar 2004, Lesser 2006, Weaver 2007). “[S]tudents can ask real questions about real-life situations. These in turn raise ethical and moral questions, which motivate students’ learning, making the subject matter more relevant and interesting.” (Rouncefield 1995)
F. De Maio (2007), p. 34: “In the minds of many students, statistical analysis bears little relevance to the important issues of the day….[s]tatistical tools which can be used to examine the distribution of income (e.g., the Gini coefficient), the progressivity of tax structures (e.g., the Kakwani index), the nature of poverty (e.g., the Sen index), or health inequities (e.g., illness concentration curves) receive little, if any, attention in most introductory courses...”
Lesser (2007): TSSJ supports GAISE, with one addition: The “Goals” section in College GAISE (ASA 2005) describes statistics audiences as some blend of producers and consumers. A TSSJ orientation would include viewing audiences as democratic citizens/participants, and include the additional goals of increasing student awareness of SJ issues (e.g., through datasets examined) and increasing ability to evaluate or even promote social change.
in terms of questions asked…. (Lesser 2007) critical components from Utts (2005): research/funding source, researchers who had contact with the participants, individuals studied and how selected, nature of measurements made and the setting, other differences in groups being compared, size of any claimed effects The TSSJ list, however, might also include questions such as: • From this particular collection, representation, or publication of data, who appears to benefit and who appears to suffer? Whose values may be implicitly represented or excluded? • Does this data or exploration offer a vehicle or tool that could be used to help understand or improve social conditions in our present world?
Areas of potential discriminationidentified by Pollack & Wunderlich(table in June 2005 Amstat News is reproduced in Lesser 2007) Labor markets: hiring, interviewing, wages, evaluation, promotion, layoffs, rehiring Education: college acceptance, financial aid, track placement, evaluation, special ed. placement, promotion Housing: steering, mortgage redlining, loan pricing, resale value; wealth accumulation Criminal justice: police behaviors, arrests, police treatment, legal representation, parole, sentencing Health care: access, insurance, quality, price, referrals
examples in JSE paper include: • Operational definitions (unemployment, poverty, homelessness, ethnicity, diversity, economic progress, etc.) • Relation of $ to education, equity • Expected value (insurance, lottery) • Inference (racial profiling, death penalty, drug testing, jury discrimination, etc.)
vignette (not in JSE paper) from a recent textbook
“Income inequality in the US is greater than in other developed nations and has been increasing. Are these numbers cause for concern? And do they accurately reflect the disparity between the wealthy and the poor? For example, as people get older their income increases. Perhaps these numbers only reflect the disparity between younger and older wage earners. What do you think?” Statistics Concepts and Controversies, 6th ed.Moore & Notz (2006, p. 232)
importance of discussing the ways that statistics are socially constructed Milo Schield (2007) Marilyn Frankenstein (2005) Joel Best (2001, 2002)
a Lesser (2007) recommendation for TSSJ: “…awareness that a comparison can be an artifact of how data is aggregated is listed by the National Council on Education and the Disciplines (2001) as essential for democracy, and would therefore be important to include” example from Lesser(2001):
some average SJ ideas • average class size (Lesser 2007) • Gau (2005): HS teachers use averages to find: ‘living wage’ > minimum wage • contextualized “leveling” interpretation:
another kind of connection to SJ:students’ sense of fairness Shaughnessy (2003) & Jacobs (1997) found HS/MS and ES students, respectively, do not value randomization in surveys and wanted a survey to be “fair” by having: (1) all students be able to choose whether to be in the survey OR (2) all subgroups (e.g., a boy and a girl from each class) represented
Pedagogy & Implementation(Lesser 2007) There are many levels of TSSJ -- analogous to the 6 pedagogical levels Anderson & Sungur (2002) give for a “community awareness component.” At the most basic level, students can be given predetermined datasets and asked to use predetermined statistical methods to analyze them. At further levels, students have more and more opportunity to discuss the context, choose the SJ topic(s), and find (or even collect) the data. Pick your level based on backgrounds, interests, available time, and the balance of goals for the course. Learn from instructors incorporating service learning, etc.
more tips on easing into this...(Lesser 2007) • Make TSSJ one of many project options • Note precedent & examples in mainstream sources & in mission statements, and (emerging) supporting evidence • Use variety of data from mainstream sources • Use understated terms (e.g., inequality vs. inequity; underrepresented vs. oppressed) • Consider how SJ can be as “neutral” as a “traditional” curriculum
A TSSJ ‘Wish List’ • More research on benefits and overcoming implementation challenges • More resources and examples compiled on a webpage... or into a TSSJ intro course textbook or supplement?
Time for DISCUSSION! We now “un-mute” you & invite you to: • Discuss what I’ve shared • Share your own ideas and/or experiences of TSSJ
WRAPPING UP JSE: www.amstat.org/publications/jse/ Webinar: www.causeweb.org/webinar/ (thanks to CAUSE for supporting this cause!) Me: www.math.utep.edu/Faculty/lesser/ (please relay SJ data/ideas you have!) ------------------------------------------------------- give feedback on this webinar using the online window that opens when this webinar ends