Download
1 / 39
390 likes | 536 Views
Hydrological, Biogeochemical, and Land-use Controls on the Isotopic Compositions of Nitrate, POM, and Biota in the Mississippi River Basin Carol Kendall USGS, Menlo Park CA Collaborators: Cecily Chang, Steve Silva, Scott Wankel (USGS, Menlo Park CA)

E N D
Hydrological, Biogeochemical, and Land-use Controls on the Isotopic Compositions of Nitrate, POM, and Biota in the Mississippi River Basin Carol Kendall USGS, Menlo Park CA Collaborators: Cecily Chang, Steve Silva, Scott Wankel (USGS, Menlo Park CA) Bill Battaglin, Don Campbell, Don Goolsby, Stephen Porter, Colleen Rostad (USGS, Denver CO) Rick Hooper (USGS, Marlborough MA) Valerie Kelly (USGS, Portland OR) Gilbert Cabana (Univ. of Quebec, Trois-Rivieres, QB) Bill Richardson, Eric Strauss (USGS, La Crosse WI) Chris Schmitt (USGS, Columbia MO) Thanks to the USGS NASQAN, USGS-NRP Hypoxia, and EPA Hypoxia Programs for financial support for these studies
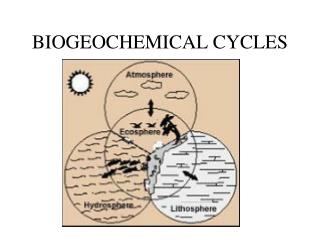
Mississippi Basin Isotope Studies A set of pilot studies to test whether the N/O isotopic compositions of nitrate, and the C/N/S isotopic compositions of POM, DOM, algae, plants, fish, and invertebrates can provide useful information about nutrient sources, land-uses, and N recycling processes that are contributing N to the Gulf of Mexico. Mississippi Hypoxia Study:Selected samples from 16 small and 8 large basins in the MR with different land uses were collected in 1997 (a few samples per site). Nitrate was analyzed for for 18O and 15N, and POM for 15N and 13C. NASQAN POM: POM samples were collected biweekly to monthly since late 1996 from some 40 NASQAN sites, 15 sites in the MR Basin, and analyzed for 15N and 13C. Lagrangian Studies of the Mississippi (MN to Gulf): POM, silt, and/or colloid samples from several Lagrangian studies were analyzed for 15N and 13C. Isotope Biomonitoring at BEST/NCBP and NAWQA sites: Investigation of the 13C, 15N, and 34S of archived fish from >100 sites in the Basin (and >100 elsewhere) as integrators/indicators of the values of river biota, nutrient sources, and land-use relations. Isotope Biomonitoring study at Pool 8: Mapping sites of active denitrification and other processes with 15N and 13C. NAWQA Algal Synoptic in Upper Mid-West: Intersite 15N and 13C variability in POM and periphyton samples was assessed by a synoptic study conducted during August 1997 along 70 smaller tributaries in the UMR basin.
Basic principles behind the use of isotopes as tracers of sources and sinks of N: • 1. Many different sources of nutrients (and other materials) have distinctive isotope ratios. • 2. Many different processes (e.g., denitrification, nitrification) change the isotope ratios of the reactants and products such that the existence and extent of that specific process can be identified by measurement of the isotope ratios of the product and/or residual reactant. Under favorable circumstances, different sources of NO3 and NH4 can have distinctive 15N values
Kohl et al. (1971): Revisited Kohl et al. (1971) Science, 174: 1331-34. Hauck et al. (1972) Science, 177: 453-54.
Trends attributed to mixing of NO3 from nitrification of soil N and fertilizer N (Kohl et al.,1971) (Hubner, 1986) Soil N Fertilizer N Trends can also be explained by denitrification denitrification mixing Solution: need more isotopes
Stable isotope tracers of sources of N: • Tracers of NO3 sources and sinks: • There are 2 stable nitrogen isotopes (15N,14N). • ratios of 15N/14N reported as 15N. • There are 3 stable oxygen isotopes (18O,17O,16O). • ratios of 18O/16O reported as 18O. • ratios of 17O/16O reported as 17O. • Tracers of NH4 sources and sinks: • 15N. • Tracers of POM and DOM sources and sinks: • 15N, 13C, 34S, etc. • Indirect tracers of NO3 transported by GW vs SW: • 18O and 2H of water.
Ranges of 15N and 18O values of different sources of NO3 Modified from Kendall (1998)
30.0 L. Calcasieu Atchafalaya R. Sabine L. Mississippi R. 29.5 Terrebonne Bay Latitude (deg.) 29.0 50 km 28.5 90.5 89.5 93.5 92.5 91.5 Longitude (deg.) Gulf of Mexico Hypoxia (N. Rabalais, 1999)
Problems • Hypoxic bottom waters in Gulf of Mexico are a result of NO3 from Mississippi River. • Amount of NO3 delivered by the River may not be in proportion to inputs in the Basin. • Transformations or losses of NO3 while it travels in the River are poorly understood. Stable isotopes of NO3 and POM may help determine NO3 sources and in-stream transformations Isotope Study Objectives • Collect baseline data on the 15N and 18O of NO3 and 15N and 13C of POM in large and small Midwestern rivers • Identify spatial and temporal variation in isotope ratios of NO3 and POM • Determine if isotope data help to: • identify sources of NO3 and POM in the Mississippi river • identify in-stream transformations of NO3 and POM
Ranges of 15N and 18O values of different sources of NO3 Modified from Kendall (1998); Battaglin et al. (2001)
NASQAN POM Study • Why should anyone care about characterizing the controls on POM sources? • 10-50% of the total N being transported by major rivers is organic N (DOM and POM). • Depending on the bioavailability of the organic N, these organic fractions can be important to local food chains (especially as a N-source to heterotrophic bacteria) and can be contributors to eutrophic conditions, such as the seasonal hypoxia at the mouth of the Mississippi. POM also transports adsorbed contaminants. Analyzed ~monthly samples for 15N and 13C, 1996 –present.
POM samples from 1996-97 15N 13C C:N This variability is not noise but interpretable signal.
The 4 main sources of particulate organic matter (POM) 2 of these 4 sources are terrestrial (leaves and soil) and 2 are formed in-situ (plankton and aquatic plants)
Typical average compositions of different POM sources C4 plants C3 plants d15N C3 soil C4 soil plankton macro-phytes C3 plants C4 plants C:N macro-phytes C4 soil C3 soil plankton d13C
POM at Warrendale (on the lower Columbia River) C:N d15N d13C Note the similarity in temporal patterns, suggesting mixing of distinct components
POM at Northport (on the upper Columbia River) C:N d13C d15N Note the decrease in C:N, suggesting decreasing amounts of terrestrial leaf materials
C:N d15N d13C POM in the Yazoo River (tributary to lower Mississippi) algal blooms
We can use these correlations to deduce biogeochemical processes and mixing relations.
Biogeochemical and hydrological controls on POM composition These and other processes and mixing relations can be inferred from correlations with isotope data.
Conclusions from POM study • 1. Although some recent sediment studies (e.g., Goni et al., 1997, 1998; Onstad et al., 2000) and several global C cycling models have concluded that refractory soil-derived material (much of which is supposedly from C4 plants) is the main source of POM to the Mississippi and Gulf of Mexico, they inadequately sampled the true temporal variability in the streams and their conclusions are thus suspect (e.g., d13C values 5‰ too high). • Much of the POM entering the Gulf is derived from in-stream productivity (plankton and bacteria), and since it is biologically labile, may be an important, but overlooked, contributor to hypoxia in the Gulf. • Variability in POM composition should be viewed as “signal” not noise. Because of the wealth of chemical and hydrological data available at USGS monitoring sites, the variability can be interpreted in terms of seasonal and spatial changes in nutrient sources and recycling mechanisms.
1997 1998 1999 2000 2001 Temporal changes in 15N and 13C of POM Note: these are preliminary data – not all samples analyzed yet.
Temporal changes in 15N and 13C of POM Note that these upper 3 sites do not show the large range of 15N values seen at St. Francisville Missouri at Hermann Mississippi at Thebes Ohio at Grand Chain Mississippi at St. Francisville Note: these are preliminary data – not all samples analyzed yet.
Lagrangian Sample Sets Samples are collected downstream in a sequence that is defined by water velocity The intent is to track a mass of water (and NO3 and POM) down the river, and Identify chemical and physical processes that alter the NO3 and POM in the river. • There are several Lagrangian sets with isotope data: • 4 from upper Mississippi to Gulf (1989-92) (POM) • 2 from middle Mississippi (Thebes) to Gulf (1997-98) (POM, NO3, water isotopes) • 1 from middle Mississippi (Clinton) to Gulf (1999) (POM, NO3, water isotopes)
Lagrangian Colloid Samples along the Mississippi River Pool 8 15N 13C 1996-97 NASQAN 15N and 13C values shown for reference
Lagrangian Colloid Samples along the Mississippi River algal 15N terrestrial terrestrial 13C algal C:N
Lagrangian Colloid and Silt Samples along the Mississippi River 15N Colloid Silt Silt Pool 8 13C Colloid
Where do we go from here? • Next steps… • Apply multi-component (isotope, chemical, hydrological) model to 5-year NASQAN POM dataset. • Build on the success of our multi-isotope tracer “hypoxia” study (sites with different land uses) was a more detailed study: the Ohio River Basin isotope study. • Better quantify atmospheric NO3 contributions using 17O of nitrate: the NE basins atmospheric NO3 pilot study. • Arrange archived samples for future analyses.
NASQAN NAWQA Integrator NAWQA Urban NAWQA Agriculture NAWQA Reference NASQAN and NAWQA sites in the Ohio Basin where DIN, DIC, POM, and water isotope samples will be collected 2 “interesting” sites in ID (studied in the hypoxia pilot study) will be re-sampled: Sugar Cr and Little Buck Cr. Plus sample 4 other sites. NAWQA: Current isotope sampling plans at WHMI sites: collect water and POM samples every time site visited (~ 20 times/yr); DIN and DIC samples ~ 7 times/yr NASQAN: Current isotope sampling plans at Ohio NASQAN sites: collect water, POM, DIN, and DIC samples every time site visited (~ 15 times/yr)
Main Objectives of our Ohio River Basin Isotope Study • Answer questions about seasonal variability in15N and 18Oof nitrate in basins of different size, soil type, and land use raised by our “Hypoxia Pilot Study” (Battaglin et al., 2001 a&b; Chang et al., in review). • Provide a more detailed (in time and space) dataset of water 18O(and2H) to answer questions raised in Kendall and Coplen (2001); in specific, to estimate relative contributions of waters (and solutes) of different residence times. • Answer questions about the controls on the 15N and 13C of autochthonous POM raised in Kendall et al. (2001). • 4) Investigate the utility of nitrate-17O as an additional tracer of nitrate sources and removal processes.
Relations Between the 18O and 17O of Terrestrial and Atmospheric Materials (caused by mass dependent and independent fractionations) 17O mixing line Terrestrial line: 17O = 0.52 (18O) 18O The 18O and 17O of atmospheric nitrate is controlled by the composition of ozone Modified from: Michalski and Thiemens, in review.
Relations between 18O and 17O values: • In all terrestrial materials, there is a constant relation between the 18O and 17O values of any given substance because isotope fractionations are mass dependent. • The mass dependent fractionation results in: • 17O = 0.52 (18O) • In many oxides derived from high atmospheric processes there “excess 17O” (beyond the 17O expected from the 18O value) derived from a mass independent fractionation (MIF) such that: • 17O = 17O - 0.52 (18O) • Hence, 17O values > 0‰ are a useful tracer of O derived from atmospheric processes. • So why is this so exciting to isotopists? • 1. 17O values provide a very persuasive indicator of an atmospheric source for the compound (i.e., nitrate, sulfate, etc) with the O. • 2.17O provides an additional tracer for nitrate, meaning that we can solve for an additional source or process term. • 3. 17O is NOT affected by any terrestrial fractionating process (e.g., denitrification).
Nitrate 17O Pilot Study in the 16 Basins Studied in the SCOPE Nitrogen Project in 1999 We hope to get monthly to quarterly samples from all 16 sites in 2002, and will analyze nitrate for 15N, 18O, and 17O, and POM for 15N, 13C, and 34S. These data should provide a valuable test of model predictions of the % of N exported from these basins that is derived from atmospheric NO3.
Continuation of our “hypoxia” nitrate/land-use studies in the UMR??
Proposal for future isotope sampling at NAWQA sites • Some NAWQA intensive sites are being sampled ~20 times this and/or next year. This provides a unique opportunity for a detailed evaluation of isotopic techniques for tracking nitrate at a variety of spatial scales and land uses. • We propose that each time chemistry samples are collected at each NAWQA site, that they collect and archive the following samples: • Nitrate isotope samples: Collect and archive ~20 ml, filtered, frozen, water samples. • POM isotope samples: Filter 1L of water through a flat, pre-combusted, glass fiber filter, freeze the filters, and archive them. • Biota isotope samples: Archive ~1 cc frozen aliquots of biological samples (algae, riparian terrestrial plants, aquatic invertebrates, fish), especially ones collected along river reaches. • Water isotope samples: Collect and archive 25 ml of water. • In large batches, send to Isotope Tracers Project.
Questions Why is there a 15N mass balance problem between 15N of nitrate and 15N of POM and sediments in the hypoxic zone? How do the several sources of N in the Basin contribute to hypoxia in the Gulf? What are the relative contributions from different sources of N (and different land uses)? Can isotopes resolve source vs recycling signatures? How can we identify zones where denitrification is removing N (ie, places to enhance the buffer strips)? What are relative contributions of denitrification vs assimilation as removal processes? Do the isotopic signatures of biota provide long-term, integrated, indicators of the isotopic signatures of dissolved N, C, and S in the environment? Can they be used to map reducing environments? Can isotopic data provide a rigorous test of SPARROW and other models that estimate changes in denitrification with scale, and spatial/temporal changes in the contributions of atmospheric nitrate? What are the relative roles of nitrate and ammonium as aquatic food sources?