Download
1 / 22
220 likes | 332 Views
HealthBound Get in the Game to Re-direct the U.S. Health System. Jack Homer Homer Consulting JHomer@comcast.net. Gary Hirsch Independent Consultant GBHirsch@comcast.net. Bobby Milstein Centers for Disease Control and Prevention BMilstein@cdc.gov.

E N D
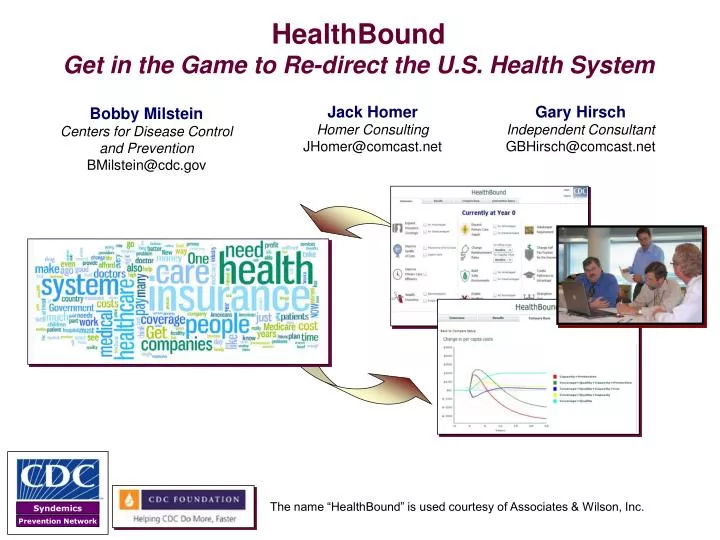
HealthBound Get in the Game to Re-direct the U.S. Health System Jack HomerHomer ConsultingJHomer@comcast.net Gary HirschIndependent ConsultantGBHirsch@comcast.net Bobby MilsteinCenters for Disease Control and PreventionBMilstein@cdc.gov The name “HealthBound” is used courtesy of Associates & Wilson, Inc. …In support of Healthiest Nation
Poised for Transformation… America has a national health shortage: we pay the most for health care, yet suffer comparatively poor health The disadvantaged fare worse Over 75% think the current systemneeds fundamental change Analyses that focus narrowly on parts of the system, without examining connections, often miss the potential for policy resistance More Money for Shorter Lives Persistent Gaps in Health by IncomePercent of Adults with Activity Limitation “Sad History of Health Care Cost Containment: 1961-2001” • Failure to foresee • Inability to enact higher leverage policies Commission to Build a Healthier America. America is not getting good value for its health dollar. Robert Wood Johnson Foundation 2008. Nolte E, McKee CM. Measuring the health of nations: updating an earlier analysis. Health Affairs 2008; 27(1):58-71. Blendon RJ, Altman DE, Deane C, Benson JM, Brodie M, Buhr T. Health care in the 2008 presidential primaries. NEJM 2008;358(4):414-422. White House. Americans speak on health reform: report on health care community discussions. Washington, DC: HealthReform.gov; March, 2009. Altman DE, Levitt L. The sad history of health care cost containment as told in one chart. Health Affairs 2002;Web Exclusive:hlthaff.w2.83.
Goal Setting Exploratory Insight Causal diagrams with practical definitions of states, rates, and interventions Experiential learning to devise strategies, interpret dynamics, and weigh tradeoffs Inflationary trends and self-sustaining tendencies of the downstream healthcare industry Creative policies for moving out of an entrenched and unhealthy state Selected CDC Models of Health System DynamicsAcross a Continuum of Purposes Important Structures Empirical Data Upstream-Downstream Dynamics Neighborhood Transformation Game HealthBound Game National Health Economics & Reform Leadership Development Syndemics Diabetes Action Labs Local Context of Chronic Disease Prevention and Control Obesity Overthe Lifecourse Fetal & Infant Health Centers for Disease Control and Prevention. Dynamic models. Syndemics Prevention Network, 2009. Available at http://www2.cdc.gov/syndemics/models.htm Homer J, Hirsch G, Milstein B. Chronic illness in a complex health economy: the perils and promises of downstream and upstream reforms. System Dynamics Review 2007;23(2/3):313–343.
HealthBoundis a Simplified Health System to be Explored Through Game-based Learning HealthBound • Cognitive and experiential learning for health leaders • Four simultaneous goals: save lives, improve health, achieve health equity, and lower health care cost • Intervene without expense, risk, or delay • Not a prediction, but a way for diverse stakeholders to explore how the health system can change Milstein B, Homer J, Hirsch G. The "HealthBound" policy simulation game: an adventure in US health reform. International System Dynamics Conference; Albuquerque, NM; July 26-30, 2009.
HealthBound Presents a Navigational ChallengeGet Out of a Deadly, Unhealthy, Inequitable, and Costly Predicament Starting Values for Mortality, Morbidity, Inequity, Cost (~2003) Deaths 8 6 0.2 Unhealthy Days 7,000 Health Inequity Healthcare costs How far can you move the system? 4 3 0.1 5,000 0 0 0 3,000 -5 0 5 10 15 20 25 Death rate per thousand Unhealthy days per capita Health inequity index Healthcare spend per capita
The U.S. health system is dense with diverse issues and opportunities Insurance overhead Extent of care Healthier behaviors ER use Reimbursement rates Adherence to care guidelines Safer environments Access to care Provider income Socioeconomic disadvantage Provider capacity Insurance coverage Provider efficiency CitizenInvolvement
Science Behind the Game Integrating prior findings and estimates On costs, prevalence, risk factors, inequity, utilization, insurance, quality of care, etc. (8 databases and large professional literatures) Using sound methodology Reflecting real-world accumulations, resource constraints, delays, behavioral feedback Simplifying as appropriate Three states of health: Healthy, Asymptomatic disorder, Disease/injury Two SES categories: Advantaged, Disadvantaged (allowing study of disparities and equity) Some complicating trends not included in simplified game (e.g., aging, technology, economy); an extended model incorporates such factors
Expand insurance coverage Improve quality of care Coordinate care Enable healthier behaviors Expand primary care supply Simplify insurance Improve primary care efficiency Build safer environments Change self pay fraction Create pathways to advantage Change reimbursement rates Strengthen civic muscle Intervention OptionsA Short Menu of Major Policy Proposals
Three Intervention Scenarios Expand Insurance Coverage Reduces the uninsured fraction by 90%Implementation Cost = $20 per person helped per year Improve Quality of Care Raises provider adherence to guidelines for preventive, chronic and urgent care (eliminating non-adherence by 50%) Implementation Cost = $10k/MD/yr.; $500k/hospital/yr. Coverage & Quality Expand Primary Care Supply Raises the number of primary care providers per capita to the Disadvantaged by 60% over 15 yearsImplementation Cost = $300k/additional MD Capacity Improve Primary Care EfficiencyRaises the fraction of primary care offices that run efficiently (eliminating inefficiency by 90%)Implementation Cost = $10k/MD/yr. Enable Healthier BehaviorsIncreases the fraction with healthier behavior (eliminating unhealthy behavior by 40% over 15 years)Implementation Cost = $2,000 per person helped Protection Build Safer EnvironmentsIncreases the fraction living in safer environments(eliminating unsafe environments by 50% over 15 years)Implementation Cost = $500 per person helped
Simulated Results: Morbidity Average Unhealthy Days per Month Days per month (average over entire population) 6 5.25 Coverage + Quality Coverage + Quality + Capacity 4.5 Coverage + Quality + Capacity + Protect 3.75 3 -5 0 5 10 15 20 25 Year HealthBound is designed for training purposes. Simulated scenarios cannot be interpreted as predictions for the future.
Simulated Results: Health Inequity Index Fraction of Morbidity Attributable to Disadvantage Health Inequity Index (Fraction) 0.2 Coverage + Quality 0.15 Coverage + Quality + Capacity 0.1 Coverage + Quality + Capacity + Protect 0.05 0 -5 0 5 10 15 20 25 Year HealthBound is designed for training purposes. Simulated scenarios cannot be interpreted as predictions for the future.
Simulated Results: Total Costs*Health Care Costs + Intervention Program Costs Dollars per capita per year 600 Coverage + Quality 300 Coverage + Quality + Capacity 0 Coverage + Quality + Capacity + Protect -300 -600 -5 0 5 10 15 20 25 * Undiscounted, constant 2003 dollars HealthBound is designed for training purposes. Simulated scenarios cannot be interpreted as predictions for the future.
Simulated Results: Net Social BenefitNet Benefit = (QALYs*$75k – Total Costs)* Dollars per capita per year 8,000 Coverage + Quality + Capacity + Protect 6,000 4,000 Coverage + Quality + Capacity Coverage + Quality 2,000 0 -5 0 5 10 15 20 25 Year * Undiscounted, constant 2003 dollars HealthBound is designed for training purposes. Simulated scenarios cannot be interpreted as predictions for the future.
Some Policy InsightsValue Tradeoffs Come to the Foreground Expanded coverage and higher quality of care may improve health but, if done alone, would likely raise costs and worsen equity Additional primary care supply and greater efficiency could eliminate current shortages (esp. for the poor), reducing costs and improving equity Upstream health protection (behavioral + environmental remedies) could reduce costs, elevate health, and improve equity,with an initial investment and a time delay,but the benefits would grow over time Milstein B, Homer J, Hirsch G. Are coverage and quality enough? A dynamic systems approach to health policy. AJPH (under review).
“Winning” Involves Not Just Posting High Scores, But Understanding How and Why You Got Them Scorecard Results in Context CompareScenarios ProgressReport HealthBound HealthBound HealthBound HealthBound
Why a Game?To Build Foresight, Experience, and Motivation to Act Expert Recommendations Experiential Learning “Wayfinding” • Who Has Been Playing? (N~500) • Federal, state, local health officials • Public health leadership institutes • Citizen organizations • Labor unions • University faculty and students • Think tanks • Philanthropists
How Strong is Civic Muscle in the Real World? • Only 8% tried to change policies in their local communities • 12% contacted public officials about issues • 33% tried to persuade friends In the aftermath of the intense 2008 presidential campaign… National Conference on Citizenship. Civic health index: civic health in hard times. Washington, DC: National Conference on Citizenship; August 27, 2009. <http://www.ncoc.net/index.php?tray=series&tid=top5&cid=2gp54>.
Conversations Around the Model STRATEGIC PRIORITIES • What’s in the model does not define what’s in the room • Simulations intentionally raise questions to spark broader thinking and judgment • Narrower boundaries tend to be more empirically grounded • Wider boundaries may legitimize “invisible” processes • Boundary judgments follow from the intended purpose and users Local intervention opportunities and costs Other health priorities Community themes and strengths SYSTEM DYNAMICS MODEL Political will Stakeholder relationships Health inequities Researchagenda Available information