Download
1 / 77
770 likes | 842 Views
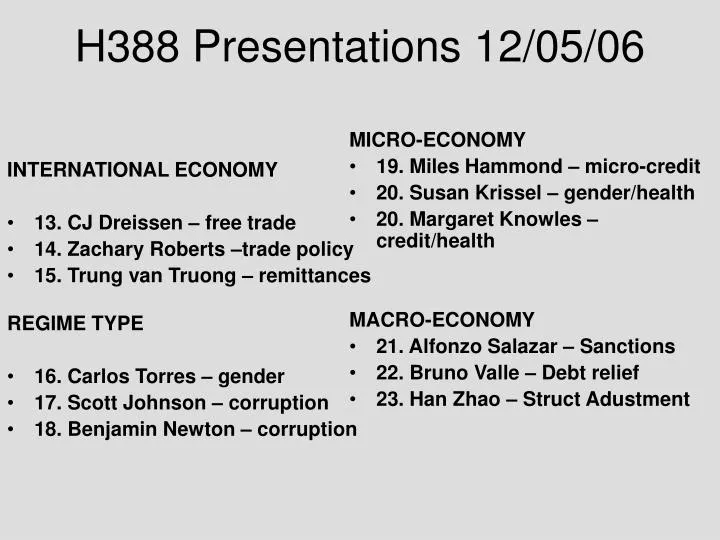
INTERNATIONAL ECONOMY 13. CJ Dreissen – free trade 14. Zachary Roberts –trade policy 15. Trung van Truong – remittances REGIME TYPE 16. Carlos Torres – gender 17. Scott Johnson – corruption 18. Benjamin Newton – corruption. MICRO-ECONOMY 19. Miles Hammond – micro-credit

E N D
INTERNATIONAL ECONOMY 13. CJ Dreissen – free trade 14. Zachary Roberts –trade policy 15. Trung van Truong – remittances REGIME TYPE 16. Carlos Torres – gender 17. Scott Johnson – corruption 18. Benjamin Newton – corruption MICRO-ECONOMY 19. Miles Hammond – micro-credit 20. Susan Krissel – gender/health 20. Margaret Knowles – credit/health MACRO-ECONOMY 21. Alfonzo Salazar – Sanctions 22. Bruno Valle – Debt relief 23. Han Zhao – Struct Adustment H388 Presentations 12/05/06
Chile: Trade and Equality 1990-2002 C.J. Driessen
Inequalities in World Food Trade Zachary Roberts December 5
Agricultural trade is much more important in developing countries vs. developed countries. In Ethiopia, agriculture is 47.5% of GDP, versus 0.5% of GDP in the United Kingdom. 80% of Ethiopia’s population works in agriculture vs. 1.5% in the United Kingdom.
African producers can grow food more cheaply than in Europe and the U.S., so the West supports the agricultural industry with an average of $238 billion in subsidies between 2001-2003. • This does not include countless tariffs and quotas on imports from developing countries, including Sub-Saharan Africa
With a complete liberalization of food trade, there would be a $300 billion increase in food trade per year by 2015. • Developing countries would account for 45% of this gain, which is highly disproportionate to their share of global GDP.
Example: Cattle Trade • Europe’s tariffs on beef make it profitable only to export high-quality beef, so poor producers who cannot produce such quality beef are cut out of the trade. This also causes a lack of quality beef on the domestic market, which depresses domestic market prices, leading to lower income for cattle herdsmen. • Also, foot and mouth disease standards for European exports cannot be met by the vast majority of African producers. The IMF estimates that African cattle herdsmen lose $1.3 billion for every European life saved by these measures.
African Liberalization • The problem is not entirely Western. Up to half of the gain that would be realized in production and incomefrom trade liberalization would result from a liberalization of trade by the African countries. • Example: After Zambia lifted restrictions on maize exports to Europe, hybrid grain producers saw an increase in income from the new market access.
Migration, Remittances, and Poverty Alleviation in Egypt Trung Van Truong HIST 388 Hunger And Poverty in the Market Economy December 5, 2006
Problem • Relations between migration, remittances, and poverty alleviation • Definitions • Situation around the world and Egypt • Why are people immigrating? • Where do remittances go? • Do they really help the economy and alleviate poverty in Egypt and other places around the globe?
Findings • Limited Data Set • Need to extend scope • Problematic; receiving countries are OECDs • IMF Records versus Stark and Adam’s findings • Some signs of poverty alleviation from remittances • Development of infrastructures in the developing countries
Parity, Polity and Equality Carlos Torres December 5, 2006 History 388 - D. Ludden
Terms • Parity - measure of the gap between HDI and GDI scores for a country. • Polity - score given by the Polity IV Project. • Equality - here, within society, measured by the Gini coefficient. • Social Investment - government expenditures in public provision of goods such as education and health care.
Problem • Many of the characteristics of gender parity are those commonly associated with liberal democracies. Is there a correlation between Democracy and parity, or are there other forces at work? • WB says the former, but there are important errors in their historical analysis of institution building.
WB Report • Stresses the importance of institutionalized structures to maintain equitable distribution of wealth and income.
But they get the distributive mechanism backwards • American case study • Depend on the presence of “authorities” (112) that didn’t exist in the colonies. • Pretend that a preexisting social/institutional structure came from Europe with the settlers, but that isn’t exactly what happened. • Brought a system of government for their internal community of settlers, but institutions were set up in response to distribution of resources in general. • Even Mayflower Compact, universally recognized as the first institutionally directive document in the New World, mentions nothing more than “binding together” for the “general good of the colony”
Curiously, the only time they seem to make this mistake is when they are talking directly about institutional formation (and implying a production mechanism of democratic political process). • Otherwise, they recognize equity as the driving force in the creation and maintenance of institutionally equitable structures, such as property rights, habeas corpus, etc… • “threats of social disorder” (from a powerful public) force democratic reform; “egalitarian distribution… eased the transition to Democracy” (114), among others
Evidence Stability is introduced to control for how the polity score is determined, but is still a less accurate determinant than the Gini coefficient. Pattern holds true across population levels, GDP and HDI levels and regime type
Institutional Formation Reality: (Cash Input) (Outcome) (Results) Health Economic Situation Education >> - wealth >> Power >> Institutional Direction --| Services - income | ^------------------------------Distribution--------------------------------------------- | Cash can only influence cash inputs, everything else has to flow out of the system organically. The cash inputs are the base of the causation chain, and an imbalance anywhere else will not create a self-sustaining shift without the cash inputs balancing as well. Institutions take time to develop and the build up of equity is a fairly slow process (45) pointing to a cause that is difficult to influence on a broad scale and must be done in the long run, rather than an instantaneous mechanism like policy or polity change.
Point is, they’re looking at the evidences of institutional problems rather than the causes and advocate in a round about way for ‘hollow’ democratic reform while simultaneously stressing the importance of solid infrastructure in maintaining equitable institutions (equitable social structures in the community, rather than imposed by the government, are the ones that last).
“Morally irrelevant” (19) categories like race, religion and gender are evidence of institutionalized inequalities, but not causative in themselves • Income, too, is evidence of unequal opportunity, but not wholly causative in itself, either • Concentration of reproductive wealth, and the power that comes from it from consequent distributions of investment in social capital (education, health care…), is the real source of distribution of power • The only way to fix the distribution of wealth is to correct the social investment disparities (34, 45) - education, health, credit availability, labor opportunities, etc…
Problem with WB approach • Advocates targeting institutions that create equitable distributions of wealth and opportunity even while it acknowledges that without the underlying infrastructure such efforts are doomed to failure.
There is no particular pattern, only a series of correlations that are more or less accurate in different situations, because the peculiarities of each country’s history cause disparities in social investment in different ways.
Solutions • Realize that systems of inequality are only correlated with certain demographic indicators and institutions, and that fixing inequalities, while targeting particular populations, involves correcting social investments, not artificially changing institutions without developing the infrastructure that supports those democratic institutions.
Measuring Corruption Scott Johnson
Indexes • Corruption Perception Index (CPI) • International Country Risk Guide (ICRG) • International Crime Victim Survey- Bribery (ICVS) • Corruption Control Index (CC)
15.3% 8.1% 8% 8.6% 7.7% 12% World Average rGDP growth rate: 2.87%
Global Corruption and on the Perpetuation of Domestic PovertyBenjamin Newton Benjamin Newton
Introduction: Global Corruption • Global corruption is the rule and not the exception • In 2006, ¾ of Corruption Perceptions Index (CPI) states scored below a “5” • Dysfunctional states share characteristics • Negative implications vary from state to state • Poor states get “stuck” in poverty
Corruption measurements are a modern phenomenon Mixed Approach Qualitative and Quantitative uses Case sensitivity Research Methodology
Case Studies • Corruption varies in different parts of the world • Public vs. private sector corruption • Some states do not have the luxury of dealing with corruption • States who see the benefits in fighting corruption will do so
Why is this Important? • Globalization is an inevitable force • Corruption serves as an inhibitor to progress • If the Global Development movement is serious, corruption will have to be effectively tackled • Efforts to curb corruption will have to be case sensitive
Micro Finance and Family Dynamics in Bangladesh Miles Hammond
Important Facts About Bangladesh • Population (2006): 147,365,352 (7th largest) • Densest pop. excluding small islands and city states • Almost 1/2 of the population lives below the poverty line • 10-15% of the population faces life-threatening nutritional risks • Per capita GDP: US $1870 • Per capita income: US $440 • Women hold 2% of parliamentary seats, make up 25% of professional and technical workers, and 8% of management and administration
How Do Micro Finance Organizations Like Grameen Bank Help? • Founded in 1974 by Muhammad Yunus • Gives small loans to rural women to farm and start cottage industries • 6.61 million current borrowers, with over 50 million borrowers since inception • Empowerment groups • Sixteen decisions
The Empowerment Index • Resources • Finance • Transaction Management • Mobility and Networks • Activism • Attitudes and husband’s behavior • Family planning and parenting issue
HDI Index suggests that Bangladesh is not doing particularly well…
The Problems • Reach insignificant portions of the poor population • Not financially viable - despite the hype • Target insignificant industries • Cycle of debt - burden falls on women • NGOs prop up existing social institutions • Ethical debate over ‘sixteen decisions’ • Promote poor business practices • Distract funds and attention from more effective forms of aid
Programs to improve maternal and child nutritional status Susan Krissel
Examples of Interventions • UNICEF • Fortification of food (ex. Iodization of salt) • Supplemental micronutrient formula with RDIs for pregnant/lactating women • Education for the empowerment of women • Baby-Friendly Hospital Initiative • International Code of Marketing of Breast Milk Substitutes
Earthwatch • Educate women about nutrition and hygiene as related to disease prevention • Involve and train community members/leaders • Make community self-sufficient • Canada Prenatal Nutrition Program • Supplementation • Community gardens • Gift certificates to buy healthy food • Cooking demonstrations and shopping tours • Nutrition and Health Awareness Education • Budgeting workshops • Breastfeeding incentives