Download
1 / 19
190 likes | 260 Views
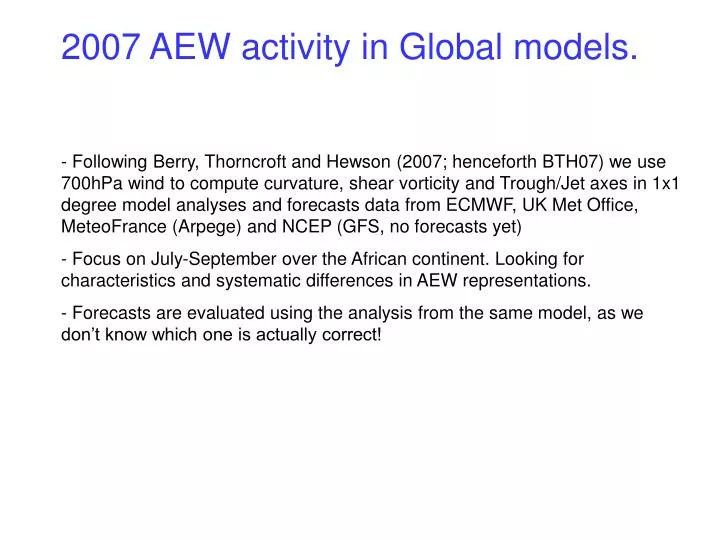
2007 AEW activity in Global models.

E N D
2007 AEW activity in Global models. • Following Berry, Thorncroft and Hewson (2007; henceforth BTH07) we use 700hPa wind to compute curvature, shear vorticity and Trough/Jet axes in 1x1 degree model analyses and forecasts data from ECMWF, UK Met Office, MeteoFrance (Arpege) and NCEP (GFS, no forecasts yet) • Focus on July-September over the African continent. Looking for characteristics and systematic differences in AEW representations. • Forecasts are evaluated using the analysis from the same model, as we don’t know which one is actually correct!
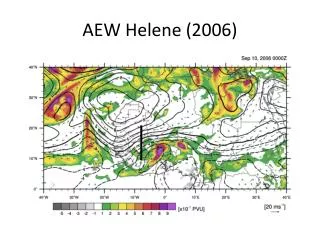
Hovmöller space-time diagrams of the 700hPa curvature vorticity, averaged 5-15N – showing the synoptic wave activity. Only positive values shown for clarity. Arpege UKMET ECMWF GFS
700hPa curvature vorticity Hovmöller summary. • All model analyses produce the same number of AEWs (26) that can objectively tracked in the individual maps, following the conventions and the rules set out in BTH07. • Relative activity in each model shows AEW confined west of the Greenwich Meridian (GM) until mid July, then high activity until mid September. Activity then tails off with smaller scale AEWs. • Clear differences in the synoptic character of AEWs on the Hovmollers: • GFS tends to produce lots of localized maxima within the AEWs (blotchiness). • UKMO appears to have the weakest AEWs, with a clear lack of activity east of 10E compared to the others. • Arpege is similar to UKMO, but with slightly more activity east of 10E • ECMWF is more a blend of the other three, with broad, long-lived AEWs. • - The maps (not shown) indicate the timing at specific locations is essentially the same for each AEW case (as far as the time resolution allows).
700hPa Shear vorticity = 0 (black contour) with 700hPa zonal wind (coloured), average 10W-10E. Figures show the location and intensity of the African easterly jet. Arpege UKMET ECMWF GFS
700hPa African easterly Jet summary. • - All models show that the peak AEW activity (mid July- mid September) coincides with AEJ axis centred near 15N. Seems to oscillate around this position with a ~2 week frequency (significant?) • The weak AEW activity to start the season occurs when the AEJ is weaker and in a variable location. • The weak AEW at the end of the season occurs after the AEJ has suddenly shifted south (approximately 10N) and strengthened. • The AEJ is strongest in the GFS. For most part the AEJ is at the same latitude in all the analyses, EXCEPT in mid-late September when the GFS is further south of others. • The jet analyses are much closer to one another than the AEWs – consistent with our hypothesis that AEWs are convectively coupled.
UKMO ECMWF MFRANCE GFS • - Maps of our diagnostics show that the trough/jet axes from the different analyses are generally highly correlated in space and time. • Largest differences exist to the east of 10E, as suggested by the Hovmöller diagrams. The UKMO does not appear to be less capable than the others. Looks like the latitudinal averaging washes out the weaker AEWs in this model. • Any differences between products do not appear to be systematic. • All model analyses have some value for the forecaster!
JAS 2007 mean 700hPa shear vorticity. Arpege UKMO ECMWF GFS
JAS 2007 mean 700hPa curvature vorticity UKMO Arpege ECMWF GFS
Shear vorticity: - UKMO has weaker shear vorticity in the region 10-30E. - All have pronounced localized maxima or couplets near Niamey, Dakar and Addis. - Widest curvature vorticity strip is in the GFS analysis, but strongest gradients in ECMWF/Arpege. - Very large values in Arpege over Sudan/Ethiopia. Curvature vorticity: - Weakest overall in GFS (due to cancellation of +ve and –ve: see timeseries), strongest in ECMWF. - In UKMO/Arpege very low 10-30E (consistent with Hovmöller diagrams).
Standard deviation of 700hPa curvature vorticity JAS 2007. UKMO Arpege GFS ECMWF
Standard deviation of 700hPa curvature vorticity JAS 2007 summary: • Highest ‘activity’ in GFS due most intense signals (see later), stretching into middle east. • ECMWF has core of strongest activity from ~10E westwards with a secondary peak near Darfur. • UKMO has weakest activity, starting near 15E. • Arpege is similar to the GFS, but with a broken ‘storm track’ between the GM and Darfur. • UKMO/GFS/ECMWF have a bullseye just downtream of Niamey (2E): is this this the impact of sounding data?
Curvature vorticity time series analysis. - Looking at curvature vorticity averaged in 3 boxes within the ‘storm track’: 15W 15E GM
Time series of curvature vorticity in GM box August 2007. • - GFS has very large range, variance >3 times that of others • UKMO, MFrance and ECMWF well correlated in terms of timing and amplitude (r > 0.6 for all). • The major peaks tend to coincide in all models and are generally associated with synoptic AEWs.
Peak 700hPa curvature vorticity values associated only with objectively identified AEWs in the three boxes: - In the GFS analysis AEWs are 2x as strong in the east than at the coast. - In the ECMWF AEWs are strongest in the east but not massively so. UKMO are strongest in the GM box. Arpege gets progressively more intense as they move towards the coast. - Using the maps, not discernable difference in start location between models.
Forecasts: Correlation coefficients of 700hPa curvature vorticity in the three boxes. Arpege UKMO ECMWF Forecasts are ‘useful’ (r>0.5) up to 2 days only. At medium range (2-4 days) the GM box has the lowest scores. The 15E box tends to be best – does this reflect the amount of model used in the analysis (due to sparse observations?).
700hPa curvature vorticity Root Mean Square errors. UKMO Arpege ECMWF GFS - RMS errors increase with time. After ~3 days the RMS error become as large as the magnitude of the 700hPa curvature vorticity in the analysis.
Mean error of 700hPa curvature vorticity forecasts (looking for persistent bias). UKMO ECMWF • In UKMO/ECMWF at 15E the short term forecasts are too intense and linearly become too weak. In Arpege are too intense at medium range (2-3 days) • In UKMO forecast at the GM and 15W have a high bias. • In ECMWF the biases at 15W and the GM are generally high (albeit small at the GM), but switch to low bias at day 5. Arpege
Summary (so far….) • Model analysis do not vary much when looking in maps for existence/location of AEWs (good news!). • Models do vary in the intensity of the analyzed AEWs by a significant amount if the GFS analysis is considered. Is this due to differences in model physics? • Quite suspicious dipoles/odd jumps appear in the means near reliable sounding locations (especially Niamey). Suggest need for data impact analysis. • Statistically, the forecasts seem poor past ~2 days.
Next Steps: • Perform a ‘case study’ of a selected period of strong AEW activity evaluating the ability (and usefulness) of forecast products in an operational sense.