Download
1 / 1
10 likes | 80 Views
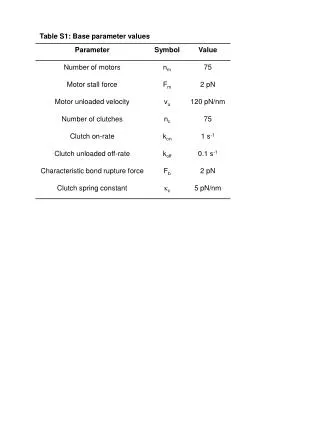
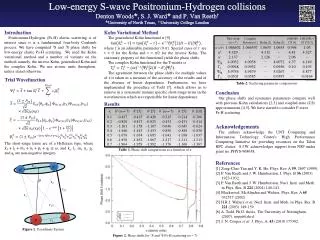
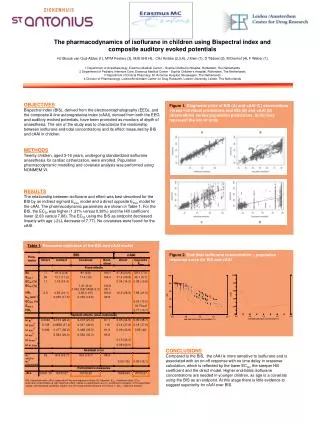
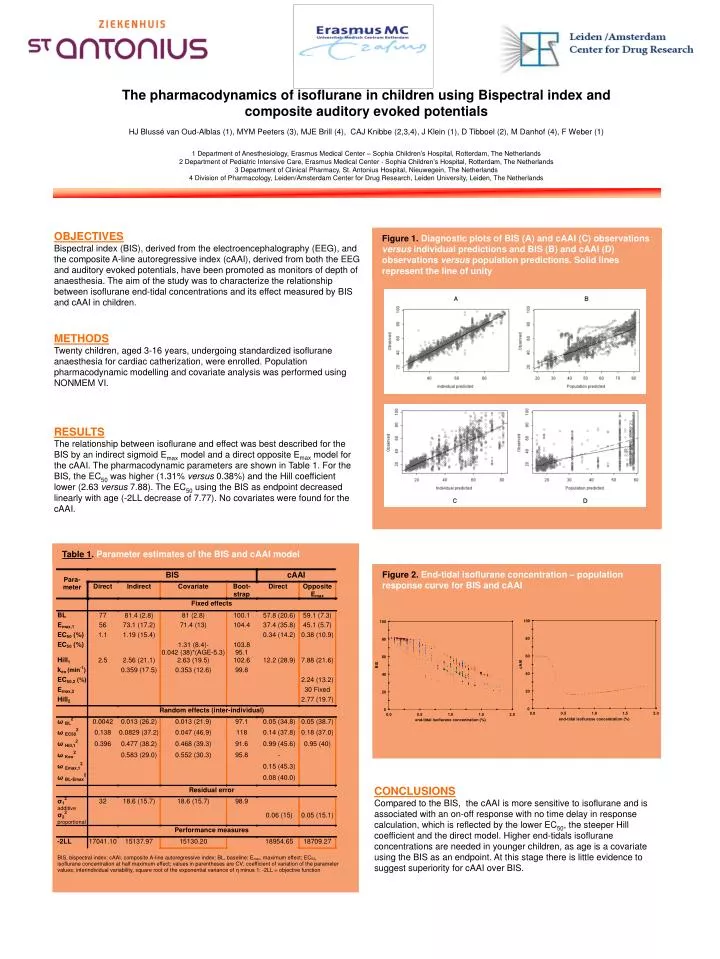
Table 1 . Parameter estimates of the BIS and cAAI model. Figure 1. Diagnostic plots of BIS (A) and cAAI (C) observations versus individual predictions and BIS (B) and cAAI (D) observations versus population predictions. Solid lines represent the line of unity .

E N D
Table 1.Parameter estimates of the BIS and cAAI model Figure 1.Diagnostic plots of BIS (A) and cAAI (C) observations versus individual predictions and BIS (B) and cAAI (D) observations versus population predictions. Solid lines represent the line of unity Figure 2.End-tidal isoflurane concentration – population response curve for BIS and cAAI The pharmacodynamics of isoflurane in children using Bispectral index and composite auditory evoked potentialsHJ Blussé van Oud-Alblas (1), MYM Peeters (3), MJE Brill (4), CAJ Knibbe (2,3,4), J Klein (1), D Tibboel (2), M Danhof (4), F Weber (1)1 Department of Anesthesiology, Erasmus Medical Center – Sophia Children’s Hospital, Rotterdam, The Netherlands2 Department of Pediatric Intensive Care, Erasmus Medical Center - Sophia Children’s Hospital, Rotterdam, The Netherlands3 Department of Clinical Pharmacy, St. Antonius Hospital, Nieuwegein, The Netherlands4 Division of Pharmacology, Leiden/Amsterdam Center for Drug Research, Leiden University, Leiden, The Netherlands OBJECTIVES Bispectral index (BIS), derived from the electroencephalography (EEG), and the composite A-line autoregressive index (cAAI), derived from both the EEG and auditory evoked potentials, have been promoted as monitors of depth of anaesthesia. The aim of the study was to characterize the relationship between isoflurane end-tidal concentrations and its effect measured by BIS and cAAI in children. METHODS Twenty children, aged 3-16 years, undergoing standardized isoflurane anaesthesia for cardiac catherization, were enrolled. Population pharmacodynamic modelling and covariate analysis was performed using NONMEM VI. RESULTS The relationship between isoflurane and effect was best described for the BIS by an indirect sigmoid Emax model and a direct opposite Emax model for the cAAI. The pharmacodynamic parameters are shown in Table 1. For the BIS, the EC50 was higher (1.31% versus 0.38%) and the Hill coefficient lower (2.63 versus 7.88). The EC50 using the BIS as endpoint decreased linearly with age (-2LL decrease of 7.77). No covariates were found for the cAAI. CONCLUSIONS Compared to the BIS, the cAAI is more sensitive to isoflurane and is associated with an on-off response with no time delay in response calculation, which is reflected by the lower EC50, the steeper Hill coefficient and the direct model. Higher end-tidals isoflurane concentrations are needed in younger children, as age is a covariate using the BIS as an endpoint. At this stage there is little evidence to suggest superiority for cAAI over BIS.