Download
1 / 40
400 likes | 505 Views
Processing, Analyzing, and Displaying Functional MRI Data. Robert W Cox, PhD SSCC / NIMH / NIH / DHHS / USA / EARTH. BRCP Hawaii 2004. Shocking Truths about FMRI !. Goal : Find and Characterize Neural “Activations” (whatever that means) Shocking Revelation #1 :

E N D
Processing, Analyzing, and Displaying Functional MRI Data Robert W Cox, PhD SSCC / NIMH/NIH /DHHS /USA/EARTH BRCP Hawaii 2004
Shocking Truths about FMRI ! • Goal: Find and Characterize Neural “Activations” (whatever that means) • Shocking Revelation #1: FMRI data are (mostly) crap • But: All other neuroimaging data are, too • You must know what you are doing! • Shocking Revelation #2: Most FMRI papers are weak on analysis
Points to Ponder & Discuss • Field has relatively poor understanding of physiological and physics issues underlying fluctuations (both “signal” and “noise”) in FMRI time series in living brain tissue • Virtually all FMRI studies are of groups • Categorizing individuals (phenotyping) is HARD • Combining & contrasting multiple human brains is non-trivial (e.g., align anatomies? how well?) • Deciding what is “significant” is tricky • Visualizing high-dimensional results at each voxel in 3D space needs more work
Caveats and Disclaimers • Almost everything herein has an exception or complication • or is also the subject of ongoing research • Special types of data or stimuli may require special analysis tools • e.g., perfusion-weighted FMRI (via arterial spin labeling) • non-repeatable tasks (e.g., drug challenge) • Special types of questions may require special data and analyses • e.g., relative timing of neural events
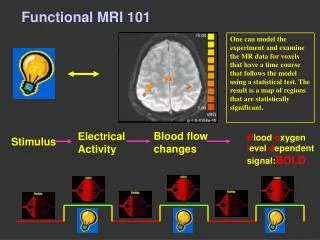
FMRI Data Acquisition & Theory • FMRI data = scan subject’s brain rapidly (2-3 s) and repeatedly (5-100 min) • Speed relatively low spatial resolution (usually) • Images are sensitized to T2*= sensitive to magnetic field perturbations on sub-voxel scale • bigger perturbations image intensity is smaller • De-oxygenated hemoglobin perturbs magnetic field • Result: FMRI time series in each voxel measures how much deoxyHB is present in that voxel • Observation: less deoxyHB more neural activity • Look for signal increases correlated with tasks • BOLD= Blood Oxygenation Level Dependent imaging
Meta-Method for Data Analysis • Develop a mathematical model relating what we know stimulus timing, behavioral measurements, image data, to what we want to know location, amount, timing of neural activity • Given data, use model to solve for unknown parameters in the neural activity (e.g., when, where, how much) • Test for statistical significance, for each task and contrasts between tasks, in individuals and groups
Why FMRI Analysis Is Hard • Don’t know the true relation between neural “activity” and measurable MRI signal • What is neural “activity”, anyway? • What is connection between neural “activity” and hemodynamics and MRI signal? • Noise in time series data from living subjects is also poorly characterized • Makes statistical assessment hard • Result: There are many “reasonable” ways to do FMRI data analysis • And no good way to judge which are “better”
Temporal Models: Linear Convolution • Central Assumption: FMRI (hemodynamic) response to 2 separated-in-time activations in same voxel is the separated-in-time sum of 2 copies of some individual task/stimulus response function • The FMRI response to a single activation is called the hemodynamic response function (HRF)
FMRI Data Analysis • Fit data time series in each voxel to a model derived from the HRF • Model is based on stimulus/task timing and on empirical models of the FMRI signal Simple HRF model: response to one brief stimulus
Linearity of Response • Multiple activation cycles in a voxel: • Assume that overlapping responses add • Result = convolution of HRF with task timing • Linearity is a good assumption • But not perfect — about 90% correct • Nevertheless, is widely taken to be true and is the basis for the “general linear model” (GLM) in FMRI analyses 3 Brief Activations
Some Sample Images (1 volume) Next slides: some voxel time series graphs
Block Design: 2 Imaging Runs model model fitted to data data 27 s “on” / 27 s “off”; t=2.5 s; 130 points/run; 9 runs/subject
Event-Related FMRI: 2 Different Voxels correlation with ideal = 0.56 correlation with ideal = –0.01 Strong activation is not obvious via casual inspection!
Time Series Analysis on Voxel Data • Most common forms of FMRI analysis involve fitting the activation+BOLD model to each voxel’s time series separately(AKA “univariate” analysis) • Result of model fits is a set of parameters at each voxel, estimated from that voxel’s data • e.g., activation amplitude, delay, shape • “SPM” = statistical parametric map • Further analysis steps operate on individual SPMs • e.g., combining/contrasting data among subjects
FMRI Activation Amplitude • Amplitude of activation (in one voxel, in one subject) = amplitude of model fitted to data • Usually fitted to all imaging runs simultaneously • Usually normalized to be in units of percent signal change from baseline (based on deoxyHB theory) • Commonly have more than one category of stimulus/task • e.g., Image Viewing: Working Memory vs. Labeling • Each category gets its own time series model • All models fitted at once using multiple regression • Each stimulus/task gets assigned its own amplitude
Multiple Stimuli = Multiple Regressors • Usually have more than one class of stimulus or activation in an experiment • e.g., “face activation” vs “house activation” • Model each separate class of stimulus with a separate response function r1(t),r2(t), r3(t), … • Each rj(t) is based on the stimulus timing for activity in class number j • Calculate jamplitude = amount of rj(t) in voxel data time seriesZ(t) • Contrast s to see which voxels have differential activation levels under different stimulus conditions • e.g., statistical test on 1–2 = 0 ?
Fixed Shape HRF Analysis • Assume a fixed shape h(t) for the HRF • e.g., h(t) = t8.6 exp(-t/0.547) [MS Cohen, 1997] • Convolved with stimulus timing, get model response function r(t) • Assume a form for the baseline • e.g., a + bt for a constant plus a linear trend • In each voxel, fit data Z(t) to curve of form Z(t) a + bt + r(t) • a, b, are unknown parameters to be calculated in each voxel • a,b are “nuisance” parameters • is amplitude of r(t) in data = “how much” BOLD
Sample Activation Map • Threshold on significance of amplitude • Color comes from amplitude • Upper Image: color overlay at resolution of EPI • Lower Image: color overlay interpolated to resolution of structural image
Variable Shape HRF Analysis • Allow shape of HRF to be unknown, as well as amplitude (deconvolution of HRF from data) • Good: Analysis adapts to each subject and each voxel • Good: Can compare brain regions based on HRF shapes • e.g., early vs. late response? • Bad: Must estimate more parameters • Need more data (all else being equal) • Usually extract some parameters from shape for inter-task and inter-subject comparisons
Sample Variable HRF Analysis Where HRF What HRF • What-vs-Where tactile stimulation • Red regions with WhatWhere
Noise Issues in Time Series • Subject head movement • Biggest practical annoyance in FMRI • Physiological noise • Heartbeat and respiration affect signal in complex ways (e.g., correlation in time and space) • Magnetic field fluctuations • Poorly understood and hard to correct: • Sometimes see 5 spikes in data with no apparent cause • Very slow signal drifts make long term experiments (e.g., learning, adaptation) difficult
Inter-Subject Data Alignment • Cortical folding patterns are (at least) as unique as fingerprints • Inter-subject comparisons requires some way to bring brain regions into alignment • So that SPMs can be averaged and contrasted in various ways • Solutions: Brain Warping and ROIs
caudate, putamen ROIs = Regions Of Interest • Manually draw anatomically defined brain regions on 3D structural MRIs • Can be tediously boring • Use ROIs to select data from each subject • Combine averages from ROIs as desired • e.g., ANOVA on signal levels • Issue: Are anatomical ROIs the “right” thing to do?
Easy Brain Warping • Align brain volume so that inter-hemispheric fissure is vertical (z), and Anterior-Posterior Commissure line is horizontal (y) • Stretch/shrink brain to fit Talairach-Tournoux Atlas dimensions • Use (x,y,z) coordinates based at AC=(0,0,0) • Accuracy: Not so good (5-15 mm) • FMRI analysts often spatially blur data or SPMs to adapt to this problem
Hard Brain Warping (3D) • Nonlinearly distort (warp, morph, transform) brain volume images in 3D to match sulcus-to-sulcus, gyrus-to-gyrus • Very computationally intensive • Accuracy: hard to gauge, since method is not widely used • Good software for this is not readily available • Issue: Very large inter-subject variability even in existence and shape of many sulci
Hard Brain Warping (2D) • Idea: Warp brain only along cortical sheet (triangulated 2D surface model) rather than general 3D transformation • Goal is still to align sulci and gyri (e.g., by matching brain convexities) • Then create a new “standard” surface model, where nodes from all subjects are aligned • Does not deal with non-cortical structures • Hope: 2D is a little easier than 3D and may be more anatomically meaningful • Not widely used at present • Software is available: FreeSurfer and SureFit
Inter-Subject Analyses • Current methodologies are based on some sort of ANOVA (after alignment) • Alternative: PCA (etc) is not much used in FMRI • Important to treat intra-subject and inter-subject variance separately • e.g., paired and unpaired t-tests, and their generalizations in random-effects ANOVA • This point is not always appreciated • Multi-way ANOVA is a method for structuring hypotheses and tests • Supplement with continuous covariates (e.g., age)? • A proper analysis will need to be more general
Standard FMRI Visualizations • 2D Grayscale anatomicals with functional activation percent change overlaid in color • 3 orthgonal 2D projections of activation maps • The SPM “glass brain” — very common in journal papers • 3D volume rendering • 3D rendering of cortical surface models • Analysis can also be performed directly on time series data projected to the cortical surface model — initial results are promising
2D Slice Array • 84 subj • 4 way ANOVA: Gender • CogTask • Valence • Subject • WM–Lab Commonly used in journal articles
3D Volume Rendering • “Show Through” rendering: • Color overlay above statistical threshold is projected outward to brain surface • 3D structure becomes apparent from rotation of viewpoint
Cortical Surface Models • Color overlay above statistical threshold is intersected with surface model • Surface model can be inflated to see into sulci
Software Tools • Several widely used packages • In order of popularity; principal authors • SPM- Wellcome Institute/London • John Ashburner • AFNI- NIMH IRP/Bethesda • Robert Cox (your humble servant) • Includes a module for realtime image analysis • FSL- FMRIB/Oxford • Steve Smith • Homegrown and/or pastiche
Points for Discussion & Comment • Variations on standard FMRI time series analyses • Directions in FMRI analysis research • Things that are hard to do with FMRI • Origins of fluctuations in FMRI activation amplitude • And what to do about them? • Visualization issues
FMRI Analyses: Variations • Spatial smoothing and spatial clustering • Data-driven analyses (“components”) • Inter-region connectivity: • Analyze data for correlations amongst activation amplitudes in different brain ROIs Z(t) Z(t) Z(t) Z(t) Z(t)
FMRI Analysis Research • Many “reasonable” space+time series analyses • Need methodologies for comparing them • Combining data from multiple scanners/centers • Closer integration of analysis to neural-level hypotheses • Cognitive models; signaling networks • Understand physiology better! • “Brainotyping”: methods for grouping and discriminating among brain maps • Application to individual patients? • Combining with X-omic data (X=gene, protein, …)? fMRI-DC fBIRN
Some Things That Are Hard in FMRI • Measuring neural effects that take a long time to occur (ten minutes or more) • Learning, adaptation; Effects of some drugs • Measuring neural effects associated with tasks that require big subject movements • Continuous speech; swallowing; head movement • Distinguishing neural events closer than ~500 ms in time • Measuring activation in brainstem nuclei • Measuring differences in timing or strength of neural activity between brain regions • Characterizing individual subject phenotypes
FMRI Amplitude Fluctuations • Task type (often the principal concern) • Subject type (concern? or confound? or both?) • Disease status, genotype, sex, age, … • Subject task performance (behavior, attention) • Neural “activation” level (whatever that is) • Physiological noise (heartbeat, breathing) • Task-related noise • Movement artifacts, breathing changes, … • Subject’s hemo-response • Different shapes, OEFs, vasculature, … • Subject monitoring and calibration?
Issues in Visualization • Regions below statistical threshold: • translucency? topographically? animation? • Multi-subject data - beyond averages? • Connectivity maps - inter-regional correlations? Dynamic Causal Modeling? • High dimensional patterns that activate much of the brain • e.g., Watching a movie • Basic problem: even after filtering out much of the crap, are left with high-dimensional info at each place in a 3D space
Finally … Thanks • The list of people I should thank is not quite endless … MM Klosek. JS Hyde. JR Binder. EA DeYoe. SM Rao. EA Stein. A Jesmanowicz. MS Beauchamp. BD Ward. KM Donahue. PA Bandettini. AS Bloom. T Ross. M Huerta. ZS Saad. K Ropella. B Knutson. J Bobholz. G Chen. RM Birn. J Ratke. PSF Bellgowan. J Frost. K Bove-Bettis. R Doucette. RC Reynolds. PP Christidis. LR Frank. R Desimone. L Ungerleider. KR Hammett. A Clark. DS Cohen. DA Jacobson. JA Sidles. EC Wong. Et alii …