Download
1 / 1
10 likes | 174 Views
Nano-Scale Observations of Zirconium Alloy Corrosion using 3D Atom Probe. D. Hudson, N. Ni, D. W. Saxey, G. D. W. Smith, C. R. M. Grovenor Department of Materials, University of Oxford, Parks Road, Oxford ,OX1 3PH, UK. Corrosion of ZIRLO: Metal-oxide interface.

E N D
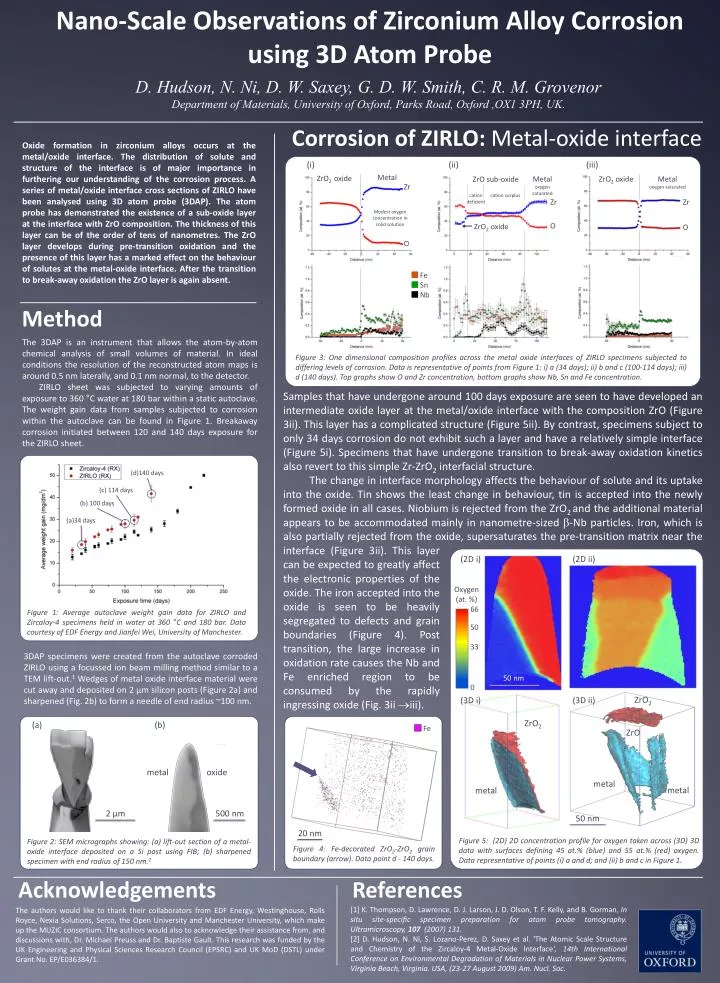
Nano-Scale Observations of Zirconium Alloy Corrosion using 3D Atom Probe D. Hudson, N. Ni, D. W. Saxey, G. D. W. Smith, C. R. M. Grovenor Department of Materials, University of Oxford, Parks Road, Oxford ,OX1 3PH, UK. Corrosion of ZIRLO: Metal-oxide interface Oxide formation in zirconium alloys occurs at the metal/oxide interface. The distribution of solute and structure of the interface is of major importance in furthering our understanding of the corrosion process. A series of metal/oxide interface cross sections of ZIRLO have been analysed using 3D atom probe (3DAP). The atom probe has demonstrated the existence of a sub-oxide layer at the interface with ZrO composition. The thickness of this layer can be of the order of tens of nanometres. The ZrO layer develops during pre-transition oxidation and the presence of this layer has a marked effect on the behaviour of solutes at the metal-oxide interface. After the transition to break-away oxidation the ZrO layer is again absent. (i) (ii) (iii) Metal ZrO2 oxide Metal oxygen saturated ZrO2 oxide Metal oxygen saturated ZrO sub-oxide Zr O cation deficient cation surplus Zr O Modest oxygen concentration in solid solution ZrO2 oxide Fe Sn Nb Method Fe The 3DAP is an instrument that allows the atom-by-atom chemical analysis of small volumes of material. In ideal conditions the resolution of the reconstructed atom maps is around 0.5 nm laterally, and 0.1 nm normal, to the detector. ZIRLO sheet was subjected to varying amounts of exposure to 360 °C water at 180 bar within a static autoclave. The weight gain data from samples subjected to corrosion within the autoclave can be found in Figure 1. Breakaway corrosion initiated between 120 and 140 days exposure for the ZIRLO sheet. Figure 3: One dimensional composition profiles across the metal oxide interfaces of ZIRLO specimens subjected to differing levels of corrosion. Data is representative of points from Figure 1: i) a (34 days); ii) b and c (100-114 days); iii) d (140 days). Top graphs show O and Zr concentration, bottom graphs show Nb, Sn and Fe concentration. Samples that have undergone around 100 days exposure are seen to have developed an intermediate oxide layer at the metal/oxide interface with the composition ZrO (Figure 3ii). This layer has a complicated structure (Figure 5ii). By contrast, specimens subject to only 34 days corrosion do not exhibit such a layer and have a relatively simple interface (Figure 5i). Specimens that have undergone transition to break-away oxidation kinetics also revert to this simple Zr-ZrO2 interfacial structure. The change in interface morphology affects the behaviour of solute and its uptake into the oxide. Tin shows the least change in behaviour, tin is accepted into the newly formed oxide in all cases. Niobium is rejected from the ZrO2 and the additional material appears to be accommodated mainly in nanometre-sized -Nb particles. Iron, which is also partially rejected from the oxide, supersaturates the pre-transition matrix near the 20 nm Figure 4: Fe-decorated ZrO2-ZrO2 grain boundary (arrow). Data point d - 140 days. interface (Figure 3ii). This layer can be expected to greatly affect the electronic properties of the oxide. The iron accepted into the oxide is seen to be heavily segregated to defects and grain boundaries (Figure 4). Post transition, the large increase in oxidation rate causes the Nb and Fe enriched region to be consumed by the rapidly ingressing oxide (Fig. 3ii iii). (2D i) (2D ii) Oxygen (at. %) 66 Zr O Figure 1: Average autoclave weight gain data for ZIRLO and Zircaloy-4 specimens held in water at 360 °C and 180 bar. Data courtesy of EDF Energy and Jianfei Wei, University of Manchester. 50 33 3DAP specimens were created from the autoclave corroded ZIRLO using a focussed ion beam milling method similar to a TEM lift-out.1 Wedges of metal oxide interface material were cut away and deposited on 2 µm silicon posts (Figure 2a) and sharpened (Fig. 2b) to form a needle of end radius ~100 nm. 50 nm 0 ZrO2 (3D i) (3D ii) ZrO2 (a) (b) ZrO (d)140 days (c) 114 days metal oxide (b) 100 days metal metal metal (a)34 days 2 µm 500 nm 50 nm Figure 5: (2D) 2D concentration profile for oxygen taken across (3D) 3D data with surfaces defining 45 at.% (blue) and 55 at.% (red) oxygen. Data representative of points (i) a and d; and (ii) b and c in Figure 1. Figure 2: SEM micrographs showing: (a) lift-out section of a metal-oxide interface deposited on a Si post using FIB; (b) sharpened specimen with end radius of 150 nm.2 Acknowledgements References [1] K. Thompson, D. Lawrence, D. J. Larson, J. D. Olson, T. F. Kelly, and B. Gorman, In situ site-specific specimen preparation for atom probe tomography. Ultramicroscopy, 107 (2007) 131. [2] D. Hudson, N. Ni, S. Lozano-Perez, D. Saxey et al. 'The Atomic Scale Structure and Chemistry of the Zircaloy-4 Metal-Oxide Interface', 14th International Conference on Environmental Degradation of Materials in Nuclear Power Systems, Virginia Beach, Virginia. USA, (23-27 August 2009) Am. Nucl. Soc. The authors would like to thank their collaborators from EDF Energy, Westinghouse, Rolls Royce, Nexia Solutions, Serco, the Open University and Manchester University, which make up the MUZIC consortium. The authors would also to acknowledge their assistance from, and discussions with, Dr. Michael Preuss and Dr. Baptiste Gault. This research was funded by the UK Engineering and Physical Sciences Research Council (EPSRC) and UK MoD (DSTL) under Grant No. EP/E036384/1.