Download
1 / 40
410 likes | 440 Views
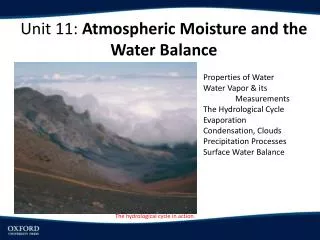
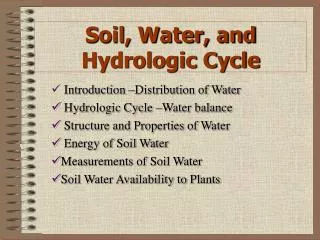
Water Balance & Water Use. The Global Hydrologic Cycle. Volume of Global Water Reservoirs. Earth’s Water Distribution. The Terrestrial Hydrologic Cycle. precipitation 3120 mm (100%). transpiration 458 mm (15%). wet canopy evaporation 624 mm (20%). forest floor evaporation 158 mm (5%).

E N D
precipitation 3120 mm (100%) transpiration 458 mm (15%) wet canopy evaporation 624 mm (20%) forest floor evaporation 158 mm (5%) root-zone storage drainage 1881 mm (60%) The Forest Water Balance
Precipitation Transpiration (2 mm/day) Evaporation Throughfall Stemflow The Tree Water Balance
Throughfall and Stemflow • Throughfall is precipitation that reaches the surface directly through spaces in the canopy and by dripping from the canopy. • Contains nutrients leached from the leaf surfaces. • Stemflow is water that reaches the ground surface by running down the trunk and stems. • More significant in smooth-barked trees. • Contains nutrients leached from leaf surfaces.
Leaf Area Index (LAI) LAI = total leaf surface of a plant X ground area projection under plant
Leaf Area Meters Leaf Area Index Optical Sensor R-T Model Hemispheric Photos
Leaf Area Index February 2003 July 2003
Leaf Area Index February 2003 July 2003
Water in the Soil-Plant-Atmosphere Continuum • Water in the soil moves along a potential gradient from wet (high energy) to dry (low energy), just like during transpiration
Water Potential () • For pure liquid water, = 0 • For almost anything else, < 0 • = m + p + g + o • m = matric potential; function of adhesion/cohesion • p = pressure potential; function of pressure applied to water (hydrostatic pressure) • g = gravitational potential; How much force is gravity using to pull the water down? • o = osmotic potential, caused by the presence of dissolved sugars and salts in water
Important Water Potentials • Field Capacity fc = -0.01 – 0.033 MPa • Permanent Wilting Point wp = -1.5 MPa, on average • Air-Dry Soil ad = -3.0 MPa
0.40 0.32 0.24 0.16 0.08 0 Available Water
Pore space at field capacity (% volume) Pore space at wilting point (% volume) 40 49 50 10 50 1 9% Available Water Sand 25 45 50 25 50 5 20% Available Water Silt 10 30 50 40 50 20 20% Available Water Clay Total Water Unavailable Water Available Water
Evaporation The gradual change of the state from a liquid to a gas, occurring at the liquid surface.
Vapor Pressure Deficit (VPD)
Evaporation (E) Daily E = E * Daylength * LAI
Transpiration The transfer of water from within leaves… through stomata… into the atmosphere.
Transpiration Transpiration causes a suction of water from the soil through the roots through the xylem (sapwood) and into the leaves.
Transpiration Penman-Monteith Equation
Transpiration • It is NOT simply a hazard of plant life! • It is the “engine” that pulls water up from the roots to: • Supply photosynthesis (1-2% of the total) • Bring minerals from the roots for biosynthesis within the leaf • Cool the leaf
Evapotranspiration Evapotranspiration is the combination of evaporation and transpiration, or the total water loss from a leaf or plant. In other words, ET = E + T
Water Shortage Correction Relative difference between transpiration and absorption of water in a tree during a sunny day with adequate soil moisture. Energy for nighttime water absorption (stomates closed) comes through tension in the water column within the xylem, which pulls water into the tree.
Solar (short-wave) radiation Convection Radiation Reflected Evapotranspiration Internal Conduction CO2 H2O Water Use Efficiency Long-wave Transmitted H2O CO2 Fig. 6.1 p. 95 Energy, water and CO2 balances over a leaf
Water Use Efficiency WUE =Carbon gain (g) Water lost (g)
Ways That Water Deficits Reduce Plant Growth • Stomatal Closure • Reduce cell expansion • Reduce phloem transport • Root/shoot partitioning increases • Leaves drop early • Decomposition decreases • Nitrogen availability decreases
8 6 Leaf Area Index 4 wet years 2 dry years 0 +30 0 -30 -60 -90 -120 Site Water Balance Site Water Balance(Precipitation – Potential ET) Oregon Coast Oregon Spruce/Fir Willamette Valley Lower Cascades Missoula Metolius Bend, OR
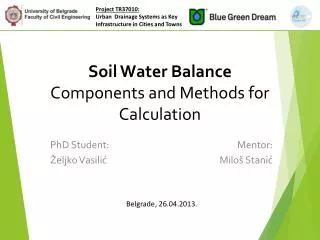
Site Water Balance Inputs: Precipitation (snow, rain, sleet etc.) Outputs: Evapotranspiration and runoff Storage: Snow, soil Precipitation+Snowmelt–ET = Outflow+Change in Soil Water Content
+ - + Simple Water BudgetRain + Snowmelt – ET = Outflow + Δ Soil Water =