Download
1 / 24
250 likes | 276 Views
THUNDERSTORM OUTFLOW AND CONVECTIVE INTERACTION. THUNDERSTORM OUTFLOW AND CONVECTIVE INTERACTION. Outflow boundaries form in regions of low- level vorticity and convergence

E N D
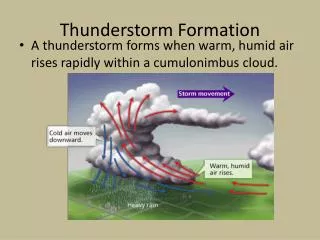
THUNDERSTORM OUTFLOW AND CONVECTIVE INTERACTION • Outflow boundaries form in regions of low- level vorticity and convergence • their passage may be associated with strong and gusty surface winds, with marked wind shear and turbulence (which may he hazardous to aircraft) extending from the surface to the top of the cold outflow air • if precipitation is falling from clouds along the arc, strong winds, shear and turbulence may extend up to the cloud base; • they may act as triggers for new storm development • If they intersect existing convection they may make the storms more vigorous and considerably more likely to produce severe weather
Convective storm low-level outflow and arc cloud lines Outflow boundary Outflow boundary Fig. 1. GOES 1 km resolution VIS image for 26 May 1975 at 1400 local time (2000 UTC), with surface observations superimposed (temperatures in “F).
Convective storm low-level outflow and arc cloud lines Fig. 2(a).Surface meso analysis at the same time as Fig 1. H denotes meso scale high Fig 2 (b). 500hPa chart solid lines gdm and dashed lines temp in ̊C
Convective storm low-level outflow and arc cloud lines • Fig. 1 shows the different scales on which thunderstorms and thunderstorm outflow boundaries may occur. • A mesoscale analysis, based on surface observations and animated satellite imagery, is shown in Fig.2(a), and a 500 hPa analysis is shown in Fig. 2(b). • An outflow boundary is evident from D to E (these often appear as arc-shaped Cu cloud lines in satellite imagery) associated with a well organized mesoscale convective system (MCS) B, which is supported by a trough at 500 hPa. • A smaller thunderstorm cell at C has an associated outflow boundary detectable at A by a band of Cu. • The arc cloud line marks the leading edge of cold air outflow produced by a thunderstorm system, often known as the gust front.
Arc cloud lines in Sat Imagery • In VIS images, arc clouds frequently appear as narrow, often broken, curved lines of bright Cu with a clear zone between the line and the parent thunderstorm system (though gust fronts can exist in some cases, obscured by overtopping Ci). • In IR images, these clouds are often shallow and warm topped or may be too small to be resolved. They can develop into new deep convection, with much colder tops, given sufficient forcing and instability. • Arc cloud lines may maintain their identity for several hours after their parent storm has dissipated.
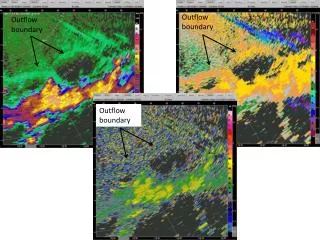
S-BAND RADAR IMAGES OVER COLORADO AT 2214 UTC ON 25 JUL 84 Fig. 3(a). Range rings are at 30 km intervals. (a) Reflectivity image showing a thunderstorm outflow boundary from a line of cells C as a fine line AB; Fig. 3(b). Doppler velocity field for the same time, showing convergence associated with AB. Orange shades represent flow away from the radar, green and blue shades towards it.
Arc cloud lines in Radar imagery • Wilson and Carbone (1984) point out that operational non- coherent radars typically do not have sufficient sensitivity to detect outflow boundaries. • However, sensitive radars, some with Doppler velocity capability, routinely show these boundaries even in the absence of clouds. • Fig. 3 is an example of a thunderstorm outflow boundary AB from a line of cells C as detected in radar reflectivity and Doppler velocity data. • In radar reflectivity imagery, an outflow boundary appears as a shallow and narrow band of enhanced reflectivity. • In Doppler velocity imagery, outflow boundaries appear as regions of low-level convergence.
CONCEPTUAL MODEL OF THE FORMATION OF AN ARC CLOUD LINE
CONCEPTUAL MODEL OF THE FORMATION OF AN ARC CLOUD LINE • It shows that arc cloud lines form in the convergence zone (CZ) between the cool outflow from the thunderstorm downdraught and warmer moist environmental air. • At the same time as the arc cloud is forming, cool stable air within the outflow is sinking, spreading out, warming dry-adiabatically, and thus experiencing a relative humidity decrease. • This subsidence leads to local stabilization and clear skies within the sinking cold dome; the sharp transition between cloud and clear skies is one of the major reasons why outflow boundaries stand out in satellite imagery (Purdom, 1973).
Outflow boundaries and new thunderstorm development • Using satellite imagery (Purdom, 1976, 1982) and sensitive radar imagery (Wilson and Carbone, 1984), it has been shown that a favoured location for new storm development is the area of interaction between a t/storm outflow boundary and another boundary or an area of organized Cu cloudiness. Purdom (1979) termed this phenomenon ‘Convective Scale Interaction’. • Under conditions of weak synoptic-scale forcing, one of the major causes of new thunderstorm development is the interaction of thunderstorm outflow boundaries with other meso scale features within the region. • These may appear as areas of organized convection in satellite imagery, or as boundary layer convergence zones in radar imagery. • The satellite images shown in Fig. 5 provide a good example of this phenomenon. Fig. 5(a) shows a large arc cloud line AB that has been produced by a thunderstorm complex over the Gulf of Mexico, and also an area of convective cloud P. • Inspection of the arc cloud line two hours later, Fig. 5(b), reveals that the amount of convection along it has decreased except at C, where it merged with the pre-existing convection P.
Outflow boundaries and new thunderstorm development Fig. 5(a). GOES-East VIS image over the Gulf of-Mexico on 30 July 1986 at 1300 local time (1900 UTC), showing an arc cloud line AB and an area of convection P; Fig. 5(b). (b) two hours later, the line has merged with the pre-existing convection at C.
Outflow boundaries and new thunderstorm development Fig. 6. Multiple exposure image made from 30-minute interval GOES VIS images showing the are cloud line AB and the northeast part of the system shown in Fig. 5.
Outflow Boundaries and New Thunderstorm Development • The vertical motion along and above the outflow boundary, which supports cloud formation in that region, is due to convergence that extends from near the surface to the top of the cool outflow air. • The time-lapse image in Fig. 6 clearly shows that the further the boundary is from its source, the more fibrous and thin the convection along it becomes. • Close inspection of Fig. 6 reveals that the speed of the arc cloud decreases with time. • Furthermore, the depth of cold air associated with the arc cloud decreases as it moves outwards.
Outflow Boundaries and New Thunderstorm Development • The amount of convective activity along the outflow decreases dramatically as the convergence decreases in depth; the resultant vertical motion is not only less than when the arc cloud originated but is also peaking at a lower level. • This helps explain the changing appearance of the convection along the arc cloud line. Therefore, something additional is needed to explain strong convective development along an outflow boundary as it moves out into the environment. The answer lies in the concept of convective-scale interaction, presented in Fig. 7.
Outflow boundaries and new thunderstorm development MODELS OF AN OUTFLOW BOUNDARY, WITH TYPICAL NUMERICAL VALUES Fig. 7. (a) Moving into a region free of convection; DSL is a density surge line, and LFC is the level of free convection. Well ahead of the outflow boundary there is negative buoyancy from the surface to the LFC.
Outflow boundaries and new thunderstorm development • Fig. 7(a) is a schematic of an outflow boundary moving into a cloud-free environment, where air below the level of free convection (LFC) is negatively buoyant. In this illustration, vertical motion along the outflow boundary is only capable of overcoming a portion of that negative buoyancy; air from the boundary layer never penetrates the LFC, and only a narrow cloud line develops above the convergence zone.
Outflow boundaries and new thunderstorm development Fig.7. (b) Moving into a region with pre-existing convection; LCL is the lifting condensation level: other abbreviations as in (a). Well ahead of the outflow boundary there is negative buoyancy only from the Cu tops to the LFC.
Outflow boundaries and new thunderstorm development • However, in the Cu region ahead of the outflow boundary, Fig. (b), the negative buoyancy between the surface and lifting condensation level (LCL), and also a portion of the negative buoyancy between the LCL and LFC, has been overcome (perhaps owing to greater moisture content, local heating or some pre-existing convergence zone). • Thus, the vertical motion generated along the outflow boundary only needs to overcome the small negative buoyancy remaining in the environment ahead of it to produce deep convection. • New strong convection develops due to arc merger with cumulus region
Outflow boundaries and new thunderstorm development • The intensity of convection along an arc cloud line is a first clue to its ability to trigger deep convection • If the LFC is not reached in the zone of forced ascent, new clouds remain shallow and the storm causing the arc cloud tends to dissipate. • If the LFC is reached, new deep convection may result and the arc cloud is maintained. • New deep convection is favoured where arc cloud lines move through areas that are convectively unstable, such as • where they meet areas of pre-existing Cu, • where they intersect other arc cloud lines • where they merge with other low-level convergence zones such as sea-breezes. • Arc clouds moving into areas of greater (lesser) stability tend to trigger weakened (intensified) storms. • Arc clouds tend to become less able to maintain deep convection after dark due to stabilization of warm sector air (unless other dynamical factors overcome this).
Outflow boundaries and new thunderstorm development • Outflow boundaries can be detected using sensitive radars This Fig. shows the development of a line of thunderstorms (XY) where two outflow boundaries (AA and BB) collided in eastern Colorado. The boundaries were not detected using satellite imagery because of high-level cloud cover obscuring them from view. Fig.8. S-band radar reflectivity images over Colorado at (a) 2226, (b) 2252, (c) 2323, and (d) 2340 UTC on 25 July 1984, showing two outflow boundaries AA and BB meeting at X; a new convective line XY forms. Range rings are at 20 km intervals. Values in dBZ.
Locating Outflow boundaries Satellite vs Radar A Rondo B A Sea Breeze boundary Arc cloud line Fig. 9. GOES-East 1 km resolution VIS image over southeast Texas on 28 Jul 80 at 1530 local time (2130 LJTC), and (inset) Rondo, Texas, radar display for the same time (Rondo is at + on the satellite image). Where an arc cloud line AA intersects the sea-breeze front BB a new storm C forms. Rain from the arc cloud line DDD can also be seen .
Locating Outflow boundaries Satellite vs Radar • Satellite and radar imagery have strengths and weaknesses for locating outflow boundaries. • Overlying cloudiness or lack of convection along an outflow boundary may preclude detection using satellite imagery. • However, an outflow boundary is a shallow phenomenon, usually only 1—2 km deep and often shallower, and decreases in depth with time; this means that it must be fairly close to a radar to be detected. • This point is illustrated in Fig. 9, where an arc cloud line AA intersects the sea-breeze front BB giving rise to a large thunderstorm C. While the features are readily detected in satellite imagery, only the thunderstorm’s echo C is detected by radar. This is because the outflow boundary and sea-breeze front are too shallow for detection by the radar at a range of nearly 160 km. The nearby boundary DDD is more easily detected.