Download
1 / 43
430 likes | 608 Views
Superstar Firms in International Trade. J. Peter Neary University of Oxford and CEPR 12 September 2011. 1. Introduction. “Two and a Half Theories of Trade”: 1.0: Perfect Competition: Comparative Advantage 2.0: Monopolistic Competition: Product Differentiation and Increasing Returns

E N D
Superstar Firms in International Trade J. Peter Neary University of Oxford and CEPR 12 September 2011
1. Introduction “Two and a Half Theories of Trade”: 1.0: Perfect Competition: Comparative Advantage 2.0: Monopolistic Competition: Product Differentiation and Increasing Returns 2.5: Oligopoly Despite growing empirical evidence: large firms matter for trade • The “2nd Wave” of micro data on firms & trade • 1st wave (1995-): Exporting firms are exceptional: • Larger, older, more productive, pay higher wages, do more R&D • 2nd wave: Even within exporters, large firms dominate: [Bernard et al. (JEP 2007), Mayer and Ottaviano (2007)] • Distribution of exporters is bimodal • The firms that matter (for most questions) are different: larger, multi-product, multi-destination • Possible to model this using a Pareto distribution with high dispersion • “Granularity”: Gabaix (2005), di Giovanni and Levchenko (2009) • I prefer to try “putting the grains into granularity”
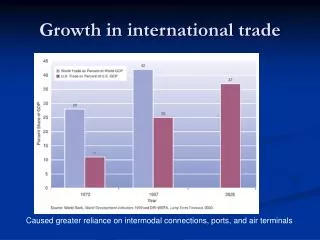
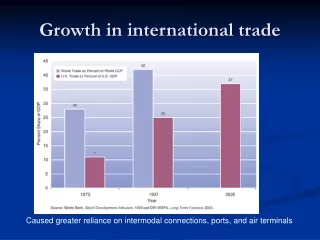
25.9% of firms 40.4% of firms 0.20% of export value 83.3% of employment 7.0% of employment • Bernard et al. (JEP 2007): • Data on U.S. exporting firms 2000 • By # of products & export destinations 1 product, 1 destination only: 5+ products: & 5+ dests.: 11.9% of firms 98.0% of export value 92.2% of export value 68.8% of employment
1. Introduction (cont.) Why does oligopoly give only half a theory of trade? In I.O. it gets equal billing: “Two faces” • Take-home messages less than overwhelming? • Cross-hauling of identical goods [Brander JIE 1980] ... • Empirically important? Friberg-Ganslandt (JIE 2006) • Competition effect of trade [Brander] ... • Also in monopolistic competition if s is variable Krugman (JIE 1999), Behrens-Murata (JET 2007), Melitz-Ottaviano (REStud 2008) • Strategic trade policy [Brander-Spencer JIE 1984] ... • Non-robust to assumptions about factor mobility and firm behaviour Dixit-Grossman (1986), Eaton-Grossman (1986)
1. Introduction (cont.) • Not embedded in general equilibrium? • This can be done: General Oligopolistic Equilibrium [“GOLE”] Neary (JEEA 2003, REStud 2007), Bastos and Krieckemeier (JIE 2009), Grossman and Rossi-Hansberg (QJE 2010), Bastos and Straume (2010) • Trade with oligopoly interesting because there is less of it, not more • Competition effects and comparative advantage interact: profit share may rise • Suggests an explanation for non-price effects of foreign competition on wages • Allows consideration of effects of trade on market structure itself Neary (2002, RIE 2002, REStud 2007) • Hard to combine with entry and exit? • Here: Some potential approaches • Based on work in progress with Carsten Eckel and with Kevin Roberts • … combining oligopoly with entry • … and with heterogeneous firms
Plan • Introduction • Oligopoly plus Free Entry • Heterogeneous Industries • Natural Oligopoly • Superstar Firms • Conclusion
Plan • Introduction • Oligopoly plus Free Entry • Heterogeneous Industries • Natural Oligopoly • Superstar Firms • Conclusion
2. Oligopoly plus Free Entry The “Integer Problem”: • Ignoring it comes close to assuming monopolistic or perfect competition: • Brander and Krugman (1983): Trade liberalization cannot lower welfare • Markusen and Venables (1988): No role for strategic trade policy • Head, Mayer and Ries (2002): No home-market effect. • Taking account of it is hard • Or is it? • Promising approach: impose restrictions on profit functions: • Bergstrom-Varian (REStud 1985): Profits depend on own costs and average of all firms’ e.g., Cournot with identical goods • Acemoglu-Jensen (CEPR WP 2009): “Aggregative games”: Profits depend on own costs and a generalised mean of all firms’: e.g., Cournot or Bertrand with CES differentiated products • Proposition: • The number of firms in any heterogeneous-firm free-entry equilibrium of an aggregative game is the same as the integer number of firms in the corresponding “lean” homogeneous-firm non-integer equilibrium.
3. Oligopoly plus Free Entry (cont.) Heterogeneous-firm equilibrium in an aggregative game: i.e., assume own effect dominates cross effect (i) Firms’ costs a random draw: cidrawn from g(ci) with positive support over [c,) (ii) Incumbents do not make losses: (iii) A new “lean” entrant would make a loss: Symmetric equilibrium: Lean symmetric equilibrium: Non-integer lean symmetric equilibrium: • Proposition: • The number of firms in any free-entry equilibrium of an aggregative game is the same as the integer number of firms in the non-integer lean symmetric equilibrium 9
Example: The Linear Cournot Model • Solution in symmetric (homogeneous-firm) case:
Plan • Introduction • Oligopoly plus Free Entry • Heterogeneous Industries • Natural Oligopoly • Superstar Firms • Conclusion
3. Heterogeneous Industries • Firm heterogeneity in monopolistic competition: • [Melitz (Em 2003)] • Firms pay a sunk cost to reveal their unit cost • Draw c from g(c) with positive support over [c , ) • Given c, they calculate their expected profits and choose to produce or exit • Exit if c < ce where p(ce) = 0 or r(ce) = f . • If exporting requires an additional fixed cost, only low-cost firms will engage in it • Extend to a continuum of industries/sectors: • Firms draw a unit cost and a sector: {c, z} • Sectors differ in their fixed costs: f(z), f´>0 • In equilibrium, sectors have different expected firm numbers
n Monopolistic Competition 16 8 Oligopoly 4 2 Monopoly 1 0 1 Equilibrium Expected Market Structure (Vertical scale is ln2n)
Plan • Introduction • Oligopoly plus Free Entry • Heterogeneous Industries • Natural Oligopoly • Superstar Firms • Conclusion
4. Natural Oligopoly So far: Fixed costs exogenous Now, allow them to be chosen endogenously Dasgupta-Stiglitz (EJ 1980), Gabszewicz-Thisse (JET 1980), Shaked-Sutton (Em 1983), Sutton (1991, 1998) Free entry condition: [Equilibrium operating profits a reduced-form function of firm numbers and market size] p(n,s) = 0 Define: Market-Size Elasticity of Market Structure: • Stability requires pn < 0 for given s • Presumption (?) that ps > 0 • So, E presumptively positive? • Clearly so in simple entry games: Cournot, Bertrand • Not necessarily positive in multi-stage games • “Natural Oligopoly” the case where E 0
Example: The Linear-Quadratic R&D+Cournot Case • Investments are unfriendly • Hence, E can be very small or negative. • Solution in symmetric non-strategic case: [“Relative efficiency of R&D” for a unit market size]
Plan • Introduction • Oligopoly plus Free Entry • Heterogeneous Industries • Natural Oligopoly • Superstar Firms • Conclusion
5. Superstar Firms Distribution of ex ante identical firms: Stage 1: Pay a fixed cost f to discover their unit cost c Stage 2: Choose to either: • Remain as a “small” firm ; or: • Pay a further cost fLto invest (in capacity/R&D/technology adoption/ product range) and become a “large” firm Stage 3: Competition in quantities or prices: • Strategic competition between large firms • …… facing a (monopolistically) competitive fringe
G(c): Cumulative distribution of unit costs Crucial assumption: G(c) G(c) c (fL ) (f ) Threshold for entry Threshold for acquisition of “superstar” technology Entry condition for “superstar” firms? Same as Section 2 only!
5. Superstar Firms (cont.) So far: Advantage of “large firms” unspecified One important case: Large firms produce a continuum of products Consistent with earlier empirical evidence Solves a technical problem: large firms are of finite, small ones of zero measure Different approaches to modelling multi-product firms: (1) I.O.: Products few and/or fixed; product line / quality competition. (2) Symmetric demands and costs Allanson and Montagna (IJIO 2005), Feenstra and Ma (2009), Nocke and Yeaple (2006) (3) Stochastic market-specific costs Bernard, Redding and Schott (AER 2009) (4) “Flexible manufacturing” Eckel and Neary (REStud 2010) Empirical evidence favours (4): Arkolakis-Muendler (2010) (2) predicts equal sales of all varieties - rejected (3) predicts sales ranks uncorrelated across markets - rejected But (2) is more tractable! Work in progress: Extend model of oligopoly with multi-product firms to allow for entry by “small” firms 24
Flexible Manufacturing Product Range “Core Competence”
Output, Price, and Cost Profiles “Core Competence” 26
Intra-Firm Effects of Globalization • “Leaner and Meaner”: • More Competition: Scope falls • Larger Market: Scale rises Outputs rise Outputs fall
Plan • Introduction • Oligopoly plus Free Entry • Heterogeneous Industries • Natural Oligopoly • Superstar Firms • Conclusion
6. Conclusion A road-map, not a model; hopefully with implications for: 1. Theory: • Reconcile the “Two faces of IO” • Large firms matter for more than just reciprocal dumping 2. Policy: • Hosting superstar firms, or not, may matter? • Fostering entrepreneurship / entry? • Competition policy in general equilibrium • Trade liberalization in oligopoly 3. Empirics: • Firm level data: Good news and bad • Errors at the top more costly • Ideally, think of the industry at the world level
6. Conclusion (cont.) Summary: • Time for Trade Theory 3.0 ... • Payoff to looking at the grains in granularity
1. Introduction Inspiration: The Krugman Oral Tradition! 1.0: Perfect Competition: Comparative Advantage 2.0: Monopolistic Competition: Product Differentiation and Increasing Returns 2.5: Oligopoly
2. How Many Theories of Trade? Perfect versus Monopolistic Competition? Perfect and/or Monopolistic Competition? • Similar assumptions • Similar implications with constant s : e.g., gravity equations • Both imply production efficiency, so can be represented by a GDP function: Dixit-Norman (1980) • Dixit and Stiglitz (1977), Helpman (1984), Feenstra and Kee (JIE 2008) Anyway: 2 full-fledged theories So, why not trade with oligopoly too? In I.O. it gets equal billing: “Two faces”
2. How Many Theories of Trade? (cont.) Why does oligopoly give only half a theory of trade? • Take-home messages less than overwhelming? • Cross-hauling of identical goods ... • Empirically important? Friberg-Ganslandt (JIE 2006) • Competition effect of trade ... • Also in monopolistic competition if s is variable Krugman (JIE 1999), Behrens-Murata (JET 2007), Melitz-Ottaviano (REStud 2008) • Strategic trade policy ... • Non-robust to assumptions about factor mobility and firm behaviour Dixit-Grossman (1986), Eaton-Grossman (1986) • Not embedded in general equilibrium? • This can be done: General Oligopolistic Equilibrium [“GOLE”] Neary (JEEA 2003) • Trade with oligopoly interesting because there is less of it, not more • Competition effects and comparative advantage interact: profit share may rise • Suggests an explanation for non-price effects of foreign competition on wages • Allows consideration of effects of trade on market structure itself Neary (2002, RIE 2002, REStud 2007)
How Many Theories of Trade? (cont.) One more reason why oligopoly matters for trade: • Empirics: The “2nd Wave” of micro data on firms & trade • 1st wave (1995-): Exporting firms are exceptional: • Larger, more productive • 2nd wave: Bernard et al. (JEP 2007): Even within exporters, big firms dominate: [Similar results for France: Mayer and Ottaviano (2007)] • Distribution of exporters is bimodal: • 40.4% of U.S. exporting firms in 2000 exported one product only; accounted for only 0.20% of export value • 25.9% of U.S. exporting firms in 2000 exported 5 or more products; accounted for 98.0% of export value • 11.9% of U.S. exporting firms in 2000 exported 5 + products to 5+ destinations; accounted for 92.2% of export value • The firms that matter (for most questions) are different: larger, multi-product, multi-destination • Possible to model this using a Pareto distribution with high dispersion • “Granularity”: Gabaix (2005), di Giovanni and Levchenko (2009) • I prefer to try “putting the grains into granularity”
How Many Theories of Trade? (cont.) One more theoretical hurdle to be crossed: • How to combine oligopoly with entry and exit? • Here: Some potential approaches • Based on work in progress with Carsten Eckel and with Kevin Roberts • … combining oligopoly with entry • … and with heterogeneous firms
3. Oligopoly plus Free Entry (cont.) For given market size s, assume profits of firm i depend on own costs ci, on the average of rivals’ costs c–i, and on n: [Bergstrom-Varian REStud 1985] pi= p(ci , c–i , n) – + – In symmetric equilibrium: ps(c,n) p(c, c, n) – – • i.e., assume own effect dominates cross effect • Start with symmetric case: • We can characterise the admissible range of c and n: • (1) ps(c,n) 0[Incumbents do not make losses] • (2) ps(c,n+1) < 0[A new entrant would make a loss]
ne (1) ps(c,n) 0[Incumbents do not make losses] (2) ps(c,n+1) < 0[A new entrant would make a loss] n n* n* is the maximum equilibrium number of firms; BUT: A real number, not necessarily an integer n*–1 ps(c,n) = 0 ps(c,n+1) = 0 c So: “Lean” symmetric equilibrium has: ne = int (n*–1, n*]
So far: Only “lean” symmetric equilibria; Now, consider symmetric equilibria with less efficient firms: n [A new lean entrant would make a loss] n* ne n*–1 ps(c,n) = 0 ps(c,n+1) =0 c So: Shaded area is the admissible region for equilibrium n in symmetric equilibria Actual equilibrum values are on the horizontal line corresponding to the integer value: ne = int (n*–1, n*]
Finally: Consider asymmetric equilibria: • Start with simplest case: monopoly vs. duopoly • Assume there is a monopoly equilibrium: • “Lean outsider” condition: • Consider a candidate duopoly equilibrium with: • Proof can be extended to oligopoly and generalised mean [mn] case: • Assume an equilibrium with n–1 firms • Replace “2” by n, c2 by mn, and cm by mn–1in above • Conclusion: There cannot be an equilibrium with n firms So: Equilibrium integer n is a monotonic function of (e.g.) industry size … and, if we know the population distribution of c, we can calculate the distribution of c in free-entry oligopoly equilibrium
Possible Cost Configurations in Duopoly (ii) Medium s (i) Low s (iii) High s c2 c2 c2 c1 c1 c1 (i) Only insider constraints bind (iii) Only lean outsider constraint binds (ii) Lean outsider constraint binds in symmetric equilibria; insider constraint in asymmetric ones 41
5. Natural Oligopoly (cont.) With multi-stage competition: +? • Presumption that dk/ds is positive: • Seade stability condition • Increase in market size raises investment (?) • Hence, for natural oligopoly: • Necessary condition: investments are “unfriendly”: • More likely the more investment responds to market size • … which is more likely if investments are strategic complements:
Sales Revenue Profiles in Home and (Larger) Foreign Market 43