Download
1 / 22
260 likes | 447 Views
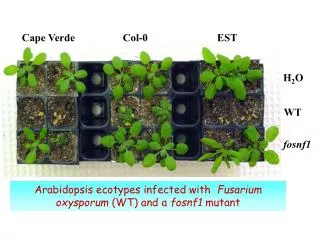
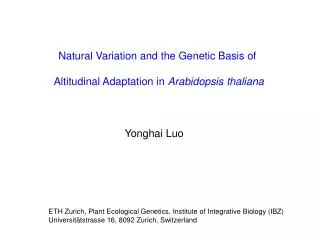
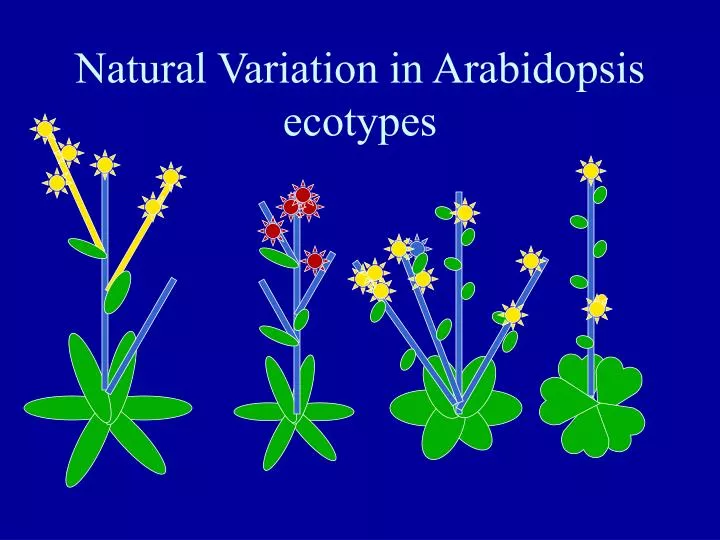
Natural Variation in Arabidopsis ecotypes. Using natural variation to understand diversity. Correlation of phenotype with environment (selective pressure?) Correlation of phenotype with phenotype. T. Mitchell-Olds. WUE. Average yearly rainfall in collection site.

E N D
Using natural variation to understand diversity Correlation of phenotype with environment (selective pressure?) Correlation of phenotype with phenotype T. Mitchell-Olds WUE Average yearly rainfall in collection site Maloof et al, 2001: Correlation of latitude with light response and Identification of responsible polymorphism in 2 ecotypes El-Lithy et al, 2004: Correlation of seed size with early but not late development rates
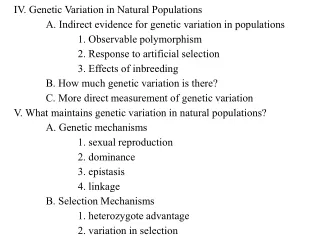
Using Natural Variation to Dissect Molecular Mechanisms Underlying Diversity What are the genes responsible for morphological differences among closely related plants (ie. size, flower number, fruit size)? What are the genes responsible for variation in environmental responses (fitness, resistance to pathogens and disease, resistance to stress, response to light)? What kind of changes occur in evolution to allow plants to adapt Under selective pressure (regulatory vs coding region changes)? How do multiple genes interact to determine plant phenotype? Can we develop better strategies for crop improvement?
Two kinds of traits can create intra-species diversity Continuous Trait Complex Or Quantitative Trait (under control of multiple Loci) # of people 4 5 6 7 Height Discontinuous Trait Simple Trait (1-2 genetic Loci control) # of people Symptoms of Muscular Dystrophy
Examples of Complex Traits • Most human diseases • Heart disease • Susceptibility to cancer • Asthma • Diabetes • Lifespan Traits of Agricultural Importance • Yield • Stress Resistance • Growth Rate • Nutrient efficiency • lifespan
Breeding for complex trait improvement Elite Line #1 Elite Line #2
Elite Line #1 Elite Line #2 10 QTL that contribute to trait 10 alleles that contribute positively to the trait 210 possible combinations of QTL alleles Markers for each QTL assist breeders in creating desired lines
Useful/cool things that QTL are good for • Marker assisted breeding • Defining interactions between loci • Identifying unknown genes involved in traits • Undetectable by forward genetics because of gene interactions, weak effect, redundancy, or null allele in starting accession • Defining genes responsible for trait variation among lines of interest • Asking questions about evolution and adaptation
In recombinant inbred lines, chromosomes are homozygous chimeras of parental chromosomes 100 50 25 12.5 6.25 3.125 1.6 .8 .4 .2 = 99.8% homozygous COL LER F1 F2 x9 Inbred Lines (F9) 1 2 3 4 5 6 7
Population of RI lines Chromosome 1 123456789……. L L S S S S S S L L S S S S L L L S S L S S S S S S S S S S L S S S S L S L S S S S L S L S S
RED YELLOW 9 4 2 1 7 RED YELLOW 8 2 1 8 9 9 8 7 8 … 2 1 3 4 … Population of RI lines Chromosome 1 123456789……. 9 8 2 1 3 4 2 1 7 8 9 1 1 3 6 7 8 1 2 9 1 2 2 2 3 1 4 4 4 5 9 1 1 3 2 9 1 8 2 2 3 3 9 9 9 1 2
Sample QTL map for chromosome 1 10 10 LOD Additive For red allele LOD Score Seed Weight (ng) 5 5 0 0 -5 Position on Chromosome 1 (cM) 1
Parents Parents # of RI lines # of RI lines Seed weight Seed weight Limitations on mapping with RI lines 1. Must be genotyped with high density of markers 2. Must be variation within population, preferably with transgression 3. Limited by # of RI line 4. Limited by # and density of markers 5. Limited by # of breakpoints in chromosomes More RI populations, high-throughput marker identification and Lines with higher number of sib-crosses before inbreeding are In progress.
Some examples of cool and innovative QTL mapping Sergeeva et al., 2004 Glc6-P (glycolysis) <----->Glc1-P (starch and cellulose) PGM Good distribution in RI lines from Cvi x Ler 2) Tissue specificity of PGM activity is variable Ler Cvi
Most of the QTL for intensity of staining in distinct regions overlapped with QTL for activity in total extracts, with similar directions. However Additional QTL found for individual tissues, and primary QTL for total extract activity doesn’t overlap with cot or root activity This study reveals the presence and location of global regulators and organ specific regulators of inportant enzymatic activity
Steve Briggs, July 2004 Arabidopsis Conference • Used level of gene expression in seedling as mapping trait • Identified QTL that regulate gene expression or are upstream of gene in regulatory pathway • Compare QTL’s from many different mapping experiments to find genes that are regulated by similar QTL’s and therefore may be co-regulated and/or function together. • This kind of approach can lead to the development of transcriptional networks, or, if done with protein level, functional networks.
Cloning genes responsible for QTLs Mendelize Fine Map Candidate gene identification, if possible Proof of gene identity by allele swapping
Mendelizing a QTL Create near isogenic line (NIL) to isolate a locus from one parent in the Background of another parent. Col Ler NIL F2 from a NIL x Col cross 3: 1-10 1: 15-18 1-10 15-25 15-18
Fine Mapping F2 from a NIL x Col cross 3: 1-10 1: 15-18 Gene in QTL region can now be Fine-mapped using molecular markers by conventional methods Candidate Gene identification (optional) based on genome annotation and knowledge of the genes affecting trait
Identification without a candidate gene and Confirmation Swap alleles of the genes between parents by: Introducing allele from one parent into null allele in other parental background Introducing dominant allele into parent carrying two copies of the recessive allele IF NO CANDIDATE GENES KNOWN, THE ABOVE METHODSUSE LARGE REGIONS (BACs) TO CONFIRM PRESENCE OF GENE, AND THEN IDENTIFY GENE BY USING PROGRESSIVELY SMALLER PIECES.
Examples of cloning genes associated with QTL QTL for flowering time assigned by candidate gene approach To CRY2 (blue light receptor), which was proved to be responsible for variation in 2 ecotypes. QTL for insect herbivory assigned by fine-mapping and candidate Gene approach to glucosinolate processing enzyme. 3 Heading time genes identified by map-based cloning ONLY in rice and found to correspond to known regulators of flowering in Arabidopsis (FT and constans)
Natural Variation in Arabidopsis ecotypes Correlation of traits with environment and with eachother Identification of loci controlling complex traits marker assisted breeding Identification of novel genes and pathways that could not be found by forward genetic screens due to interaction, small affect or null allele Defining the molecular nature of intra-species diversity