Download
1 / 1
10 likes | 179 Views
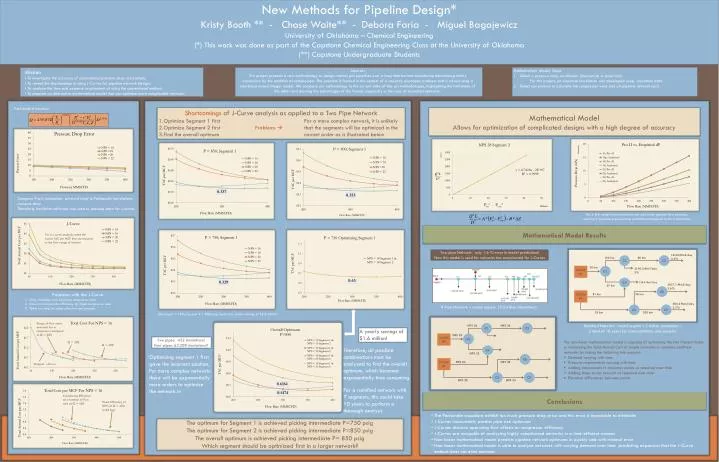
New Methods for Pipeline Design* Kristy Booth ** - Chase Waite** - Debora Faria - Miguel Bagajewicz University of Oklahoma – Chemical Engineering (*) This work was done as part of the Capstone Chemical Engineering Class at the University of Oklahoma (**) Capstone Undergraduate Students.

E N D
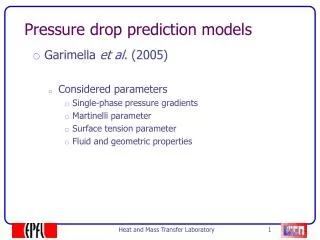
New Methods for Pipeline Design* Kristy Booth ** - Chase Waite** - Debora Faria - Miguel Bagajewicz University of Oklahoma – Chemical Engineering (*) This work was done as part of the Capstone Chemical Engineering Class at the University of Oklahoma (**) Capstone Undergraduate Students • Mission • To investigate the accuracy of conventional pressure drop correlations • To reveal the shortcomings in using J-Curves for pipeline network designs • To analyze the time and expense requirement of using the conventional method • To propose an alternative mathematical model that can optimize more complicated networks Abstract This project presents a new methodology to design natural gas pipelines over a long time horizon considering determining timely expansions by the addition of compressors. The problem is framed in the context of a capacity expansion problem and is solved using a non-linear mixed integer model. We compare our methodology to the current state-of-the-art methodologies, highlighting the limitations of the latter and showing the advantages of the former, especially in the case of branched networks. • Mathematical Model Steps • Select a pressure drop correlation (theoretical or empirical) • For this project, an empirical correlation was developed using simulation data • Select correlations to calculate the compressor work and all pipeline network costs Panhandle A equation • Shortcomings of J-Curve analysis as applied to a Two Pipe Network • Optimize Segment 1 first • Optimize Segment 2 first Problems • Find the overall optimum Mathematical Model Allows for optimization of complicated designs with a high degree of accuracy For a more complex network, it is unlikely that the segments will be optimized in the correct order as is illustrated below Compare Pro-II simulations pressure drop to Panhandle correlations pressure drop Therefore, simulation software was used to produce data for J-curves The A & B values from simulations are used in the general flow equation, resulting in accurate pressure drop predictions compared to Pro-II simulations Mathematical Model Results For a J-curve analysis, select the lowest TAC per MCF that corresponds to the flow range of interest Two-pipe Network: only 1.6 % error in model predictions! Now this model is used for networks too complicated for J-Curves 18.24 Mm3/day 2.3% 102 km C2 80 km C3 30 km 23,000 HP C1 2148.2 Mm3/day 3% C4 134.4 Mm3/day 3617.1 Mm3/day 2.6% 57 km C6 27,000 HP • Problems with the J-Curve • Only estimates costs at unique compressor sizes • Does not incorporate efficiency for fixed compressor sizes • Takes too long for data collection and analysis 81 km 38 km 384.2 Mm3/day 3.7% 9-Pipe Network – would require 15.5 billion simulations! C5 C7 25 km 200 km Choosing P = 750 psig over P = 800 psig results in a yearly savings of $2.5 million! Ramified Network : would require 1.1 billion simulations - a total of 10 years for data collection and analysis! NPS 24 C2 NPS 24 C3 A yearly savings of $1.6 million! NPS 24 23,000 HP C1 Two pipes: 432 simulations! Four pipes: 62,208 simulations!! • The non-linear mathematical model is capable of optimizing the Net Present Value or minimizing the Total Annual Cost of simple networks or complex ramified networks by taking the following into account: • Demand varying with time • Pressure requirements varying with time • Adding compressors to consumer points as required over time • Adding loops to the network as required over time • Elevation differences between points C4 Therefore, all possible combinations must be analyzed to find the overall optimum, which becomes exponentially time consuming NPS 32 Optimizing segment 1 first gave the incorrect solution. For more complex networks there will be exponentially more orders to optimize the network in C6 27,000 HP NPS 24 NPS 28 C5 C7 NPS 28 NPS 24 For a ramified network with 7 segments, this could take 10 years to perform a thorough analysis Conclusions • The Panhandle equations exhibit too much pressure drop error and this error is impossible to eliminate • J-Curves inaccurately predict pipe size optimums • J-Curves discount operating flow effects on compressor efficiency • J-Curves are incapable of analyzing highly complicated networks in a time-efficient manner • Non-linear mathematical model predicts pipeline network optimums in quickly and with minimal error • Non-linear mathematical model is able to analyze networks with varying demand over time predicting expansion that the J-Curve • method does not even consider The optimum for Segment 1 is achieved picking intermediate P=750 psig The optimum for Segment 2 is achieved picking intermediate P=850 psig The overall optimum is achieved picking intermediate P= 850 psig Which segment should be optimized first in a larger network?