Download
1 / 33
340 likes | 345 Views
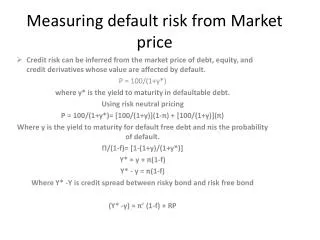
Financial Market Theory II: Risk Premium Theories 1-Default, liquidity and Macro Risks. Dr. J. D. Han King’s College University of Western Ontario. Interest Rates? Which one?.

E N D
Financial Market Theory II:Risk Premium Theories 1-Default, liquidity and Macro Risks Dr. J. D. Han King’s College University of Western Ontario
Interest Rates? Which one? • There are millions of different interest rates or rates of return in the financial market, specific for each borrower and for each asset. • Why are they different from each other? • Core/Representative Interest Rate = Rate of Returns(YTM) of Short-term Riskfree T-Bill(rf): “The Bank Rate”. • An Actual Interest Rate = rf + Risk Premium. • Risk Premium varies across the board and over time. • There are a variety of interest rates for borrowers or rates of return(or YTM) for investors.
Competition and Risk • Bonds are close substitutes for each other; Competition among them move all the interest rates more or less in the same direction • In particular, different Risk features at a time and varying evaluations of them over time lead to divergence in rates of returns or interest rates attached to different bonds at a time and over time.
Different Rates of Returns on Different Bonds Yield R = rf + Risk Premium The higher is the Risk, the higher the Yield should be; 1. Default/Credit Risk: Bond Ratings for different borrowers 2. Liquidity Risk: Term Structure (1) Conventional Theory (2) Preferred Habitat Theory 3. Inflation(=Macroeconomic) Risk :Term Structure (1) Inflation Expectations Theory of Economics (2) Portfolio Substitution Theory by Harvey Campbell 4. (Financial) Market Risk: Risk measure for different fin. assets (1) Mean Variance Theorem with s (2) Capital Asset Pricing Model with b
There is one more risk but • Idiosyncratic risk: specific to a firm, not general risk. • It is follows random walk over time: meaning that its mean =0 and standardized variance =1 • Thus it is not predictable, and thus there is no way to set risk premium, which is a priori.
* Preview: Risk Premium on Different financial assets consists of • Default/Credit Risk – “The lower the Bond Rating, the higher the rate of return should be.” • (Financial) Market Risk (1) Mean Variance Theorem – “The higher the SD (=variance), the higher the rate of return should be.” (2) Capital Asset Pricing Model – “The higher the non-standardized Correlation(b) with the Market, the higher the rate of return should be.” • Liquidity Risk (1) Conventional Theory- “The longer the maturity, the higher the rate should be” (2) Preferred Habitat Theory- “Some term assets might have higher liquidity risk premium for some others” • Macroeconomic / Inflation Risk (1) Expectations Theory- “The higher the inflation risk, the higher the rate should be.” (2) Portfolio Substitution Theory- “The more demand, the lower rates.”
*(Bond) Credit Rating Agencies • Only 5 rating companies have the Nationally Recognized Statistical Rating Organization (NRSRO) designation, and are overseen by the SEC in their assignment of credit ratings: • Standard & Poor's (S&P), Moody's, Fitch, A. M. Best and Dominion Bond Rating Service.
Canadian Examples • Dominion Bond Rating Services http://www.dbrs.com/intnlweb/jsp/search/listResults.faces • Standard and Poor’s in Canada http://www2.standardandpoors.com/portal/site/sp/en/ca/page.topic/ratings_corp/2,1,3,0,0,0,0,0,0,0,4,0,0,0,0,0.html
Moody’s Aaa (“best quality”) Aa (“high quality”) A (“uppper-medium-grade”) Baa (“medium grade”) _____________ Ba (“Speculative”) B Caa Ca C Standard & Poor’s AAA (“extremely strong”) AA (“very strong”) A (“strong”) BBB (“adequate” or “fair”) _________ BB(“uncertain” or “speculative”) B CC (“extremely vulnerable”) * Scales of Bond Rating Canadian Bond Rating Services – Combined with S & P’s
Scales of Credit Ratings * Below BBB, or Baa are “Junk Bonds”.
*Junk Bonds? • Bonds are generally classified into two groups - "investment grade" bonds and "junk" bonds. Investment grade bonds include either Standard & Poor's (AAA, AA, A, BBB) or Moody's (Aaa, Aa, A, Baa). • The term "junk" is reserved for all bonds with Standard & Poor's ratings below BBB and/or Moody's ratings below Baa. • Investment grade bonds are generally legal for purchase by banks; junk bonds are not.
Practical question is: • One level difference in bond rating leads to what percentage difference in risk premium?
One answer at one point of time is: By John Hull at Rotman School of Business
**Some Canadian Examples:Source:http://www.standardandpoors.com/RatingsActions/RatingsLists/CanadianIssuers/index.html • Ontario Government AA • Quebec Government A • York Municipality AAA • Rogers Cable systems BB • Xerox Canada BBB • New Foundland A • Nova Scotia A • New Brunswick AA • Nortel Network A • Pacific Northern Gas BB • Air Canada BB • Alberta Government AAA or AA • Canadian Government AAA
Inner-operation and criticism • It has still the element of ‘art’ rather than ‘science’. • Bond Rating Agencies are being blamed for the current financial crisis.
Different Interest Rates for a variety of Terms to Maturity: Term Structure of Interest Rates Same Government Bonds with Different Maturity Dates Ontario Government Bonds which will mature and be repaid in six months; Ontario Government Bonds which will mature and be repaid in one year; Ontario Government Bonds which will mature and be repaid in two years; Their annual actual interest rates (annual yields, annual rate of returns) differ from each other
2. Liquidity Risk and Premium: two competing theories (1) Liquidity Risk Premium Theory -> The longer the borrowing term, the higher the liquidity risk is and thus the higher the risk premium and the YTM should be. YTM is an increasing function of the (length of) terms. (2) Preferred Habitat Theory (Market Segmentation) -> The liquidity risk premium of short-term bonds might be higher for the investment by insurance or pension funds than the risk premium of long-term bonds.
* Market Segmentation and Preferred Habitat Theory • Market Segmentation Theory -The markets for short-term and long-term bonds are segregated and there is no substitution between the two instruments • Preferred Habitat Theory • Different “preferred habitats” for different investors • Example: For an insurance company, the long-term bond is preferable. The company would not hold short-term bonds unless it is paid premium. Here, the short-term bonds should be discounted or carry the term premium.
3. Macroeconomics Risk (1) Inflation Expectations Theory The long-run interest rate is the average of the current actual interest rate and the expected future short-run interest rates, which reflect the contemporary monetary conditions: Rn: annual yield of bond with n years to maturity date; R1: annual yield of bond with 1 year to maturity date; E n-1 1: expected annual yield on a 1-year bond for one year starting n-1 years from today.
Note well • What is published in the newspaper and thus is known to us is the Term Structure of YTM of bonds. • We are trying to calculate from it the One Year Interest Rates expected by the Financial Market and reflected on the Term Structure.
*Example I: Expectations Hypothesis**Simplifying Assumptions: no risk difference; no liquidity premium • The current annualized interest rate is 10% for a one-year bond, and 12% for a two-year bond. • What is the expected one-year interest rate for the next year, or E11? 1. Option I: Investing on a 2 yr bond 12% 12% 2. Option II: Rolling over investment on 1 yr bonds 10% ? 3. Returns on Option I = Returns Option II
*Example II: Expectations Hypothesis • We assume the same risk for the short-term and the long-term bonds- Ignore liquidity risk. • Suppose that the current and the expected yields on a 1-year short-term bonds are as follows. R1 E11 E21 E31 E41 14% 13% 12.5% 12% 11.5% • What would be the actual rate of returns on the long-term bonds?: R2 = ? R3 = ? R4 = ? R5 = ?
The Answer to Example II • R1= 14%; R2 = 13.5%; R3 = 13.2%; R4 = 12.9%; R5 = 12.6% “Term Structure” • Note: As E goes down, R goes down too. • Yield Curve is a graphic representation of the Term Structure % 0 1 2 3 ……………… yrs : Terms to Maturity
** Expectations Theory of Interest Rate: Monetarist View • Quantity Equation of Exchange: MV = P y - D% M = D% P , where D% P = p • Fisher Equation:R = r + pe • Combining the two: we get RA = rA + peA and R B = rB + pe B RA - R B = (rA - rB ) + (pe A - pe B ) - A lower interest rate means a strict monetary policy - Either a lower inflation - Or a slower business
(2)Harvery Campbell’s Portfolio Substitution Theory • “Inverted Yield Curve is observed just prior to Recession” : The longer the term, the lower the rates. • See Slide #18 • This is the most certain leading indicator of business cycles.
**Two Explanations for Havey Campbell’s Theory • Inflation Expectation Theory from economics side: A lower long-term interest rate means that either a lower rate of inflation or a slowing down of the economy(Keynesian idea) is expected for the future. 2) Portfolio Substitution Theory from Finance side: • When people expect a recession (not permanent), people would like to shift their investment into a safe haven; from short-term investment(bonds) to long-term investment (bonds) • Demand for, and Price of Long-term bonds go up • Yield of Long-term bonds falls – “Inverted Yield Curve”
*Empirical Evidences i)J. Haubrich and A. M. Dombrosky tested the predictive power of the spread between the long-term and short-term bond yields. - Regression Model: DY = a + b (R10-year – R3-month T-Bill) - Data: 1961:1Q to 1995:IIIQ of U.S. - Results: • Y = 1.83 + 0.97 (R10-year – R3-month T-Bill) • hat is 0.97 with its t-value=4.50, being very significant. The spread has a substantial predictive power. The yield curve emerges as the most accurate predictor of real economic growth (better than more sophisticated leading index of business cycles).
ii) New Empirical Evidence by Harvey Campbell(1989): - Use the term-structure interest rate spread (=long-term interest rate – short-term interest rate) and other known leading indicator for the regression forecasting the economic growth - Compared two predictors of the spreads and other Leading indicators by their R2 - Two Regression Results DY = a + b (R10-year – R3-month T-Bill) R2 = 0.30 to 0.45 versus DY = a + b (Stock Price Index as The Leading Indicator) R2 = -0.004 to 0.045 (Interpretation) The first is better than the second: bond market reveals more information about future economic growth than stock market.
*When we combine Expectations Theory and Liquidity Premium Theory: • Let’s suppose that the one-year interest rate over the next five years is expected to be 5%, 6%, 7%, 8% and 9%. Investors’ preferences are such that the liquidity premiums for one-year to five-year bonds are 0%, 0.25%, 0.5%, 0.75%, and 1% respectively. What is the actual interest rate on a two-year bond and a five-year bond? • Answer: 5.75% and 8%.
4. Financial Market Risk • It will go to the next separate PPP.