Download
1 / 31
310 likes | 506 Views
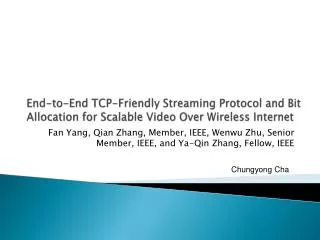
End-to-End TCP-Friendly Streaming Protocol and Bit Allocation for Scalable Video Over Wireless Internet. Fan Yang, Qian Zhang, Wenwu Zhu, and Ya-Qin Zhang IEEE Journal on Selected Areas in Communications, May 2004. Outline. Introduction Design issues Packet loss Delay variation

E N D
End-to-End TCP-Friendly Streaming Protocol and Bit Allocation for Scalable Video Over Wireless Internet Fan Yang, Qian Zhang, Wenwu Zhu, and Ya-Qin Zhang IEEE Journal on Selected Areas in Communications, May 2004
Outline • Introduction • Design issues • Packet loss • Delay variation • TCP-friendly • WMSTFP • Estimation of network conditions • End-to-end rate distortion • Simulation results
Design issues of streaming over wireless Internet • The end-to-end packet loss can be caused by • the congestion loss occurred in the wired network • the erroneous loss occurred in the wireless network • The variation in end-to-end delay is large. • Packet loss ratio and round-trip time (RTT) is usually used by streaming protocol to adjust sending rate. • The streaming protocol should be friendly to TCP.
System architecture (2/2) • WMSTFP congestion control (sender) • Adjust sending rate based on the feedback information. • WMSTFP network monitor (receiver) • Analyze the erroneous loss rate (wireless) and congestive loss rate (wired). • Estimate the end-to-end available network bandwidth. • Network-adaptive ULP channel encoder • Protect different layers of PFGS according to their importance and network status using RS codes. • Loss differentiated R-D-based bit allocation • Make the total sending rate adapt to the estimated network conditions.
Features of WMSTFP • Accurate loss differentiation • Detect packet losses caused by the erros in wireless channels using the information acquire at the link-layer. • Forward loss ratio estimation • Packets have different loss patterns. (different loss burtiness lengths) • Smoothed RTT measurement
Overview of the protocol • The process of the protocol: • estimating loss rate (congestive and erroneous); • estimating RTT and retransmission time out (RTO); • estimating the available network bandwidth and adjusting the sending rate. • After slow-start, the sender adjusts its sending rate based on the congestive packet loss ratio, RTT, and RTO.
RTT and RTO estimation (1/2) avoid the clock synchronization issue is set to 0.75
RTT and RTO estimation (2/2) k is set to 4 is set to 0.25
End-to-end packet loss differentiation and measurement • Use the link-layer information to differentiate the wireless erroneous loss and congestive loss. • In the third-generation (3G) wireless communication system, we can deduce a packet loss caused by wireless errors based on the information provided in the radio link control layer (RLC). • We can even get more detailed statistical information such as frame error rate at the radio resource control layer (RRC).
Network-adaptive ULP • Applying ULP scheme to different layer to provide prioritized transmission. • When the network is in good status, more bit budget should be assigned for source coding and fewer bits should be assigned for channel coding. • On the contrary, when network condition is bad, it is necessary to allocate more bits for channel coding, thus fewer bits should be allocated for source coding.
Loss patterns (2/3) • Different loss patterns have different impact on the perceived QoS quality in video streaming.
Loss patterns (3/3) Assume the loss pattern is randomly distributed. Comparisons of the 55th reconstructed frame under different schemes.
End-to-end rate distortion DT: end-to-end distortion Ds: source distortion (caused by quantization & rate control) Dc: channel distortion (caused by packet loss) Rs: source coding rate Rc: channel coding rate
Problem formulation (1/2) • Allocatethe available bit ratesuch that the optimal Rsand Rcare obtained by minimizingend-to-end distortion under the constraint Rs + Rc≤ RT. (RT is the estimated network bandwidth)
Problem formulation (2/2) not congested & wireless error Pc, layer(i, j) is the probability that the jth packet in the ith layer is lost due to congestion. Pw, layer(i, j) is the probability that the jth packet in the ith layer is lost due to wireless errors.
Comparisons of throughput for TCP and WMSTFP connections Why TCP is better than WMSTFP?
FER = 0.3 FER = 0.1 FER = 0.2 Throughput comparisons under different FER TFRC (TCP-friendly rate control protocol) Why WMSTFP is now better than TFRC?
Overall packet loss rate under different FER TFRC has the higher loss rate. TCP has the higher throughput?
Performance of loss differentiated R-D-based bit allocation scheme • FULP-T • fixed ULP without loss pattern differentiation over TFRC • FULP-W • fixed ULP without loss pattern differentiation over WMSTFP • AULP-W • adaptive ULP over WMSTFP
FER = 0.2 FER = 0.3 Average PSNR of different schemes under different bit rates
Average PSNR comparisons for foreman using different schemes FER = 0.3 FER = 0.2
FER = 0.3 FER = 0.2 PSNR comparisons for foreman using different schemes
Comparison of the reconstructed frames under different FERs (1/3) AULP-W FER = 0.3 FER = 0.2
Comparison of the reconstructed frames under different FERs (2/3) FULP-W FER = 0.3 FER = 0.2
Comparison of the reconstructed frames under different FERs (3/3) FULP-T FER = 0.3 FER = 0.2