Download
1 / 1
10 likes | 120 Views
Evaluating CMIP Simulations of Historical Continental Climate Using Koeppen Bioclimatic Metrics. Thomas Phillips and Celine Bonfils Program for Climate Model Diagnosis and Intercomparison (PCMDI) Lawrence Livermore National Laboratory .

E N D
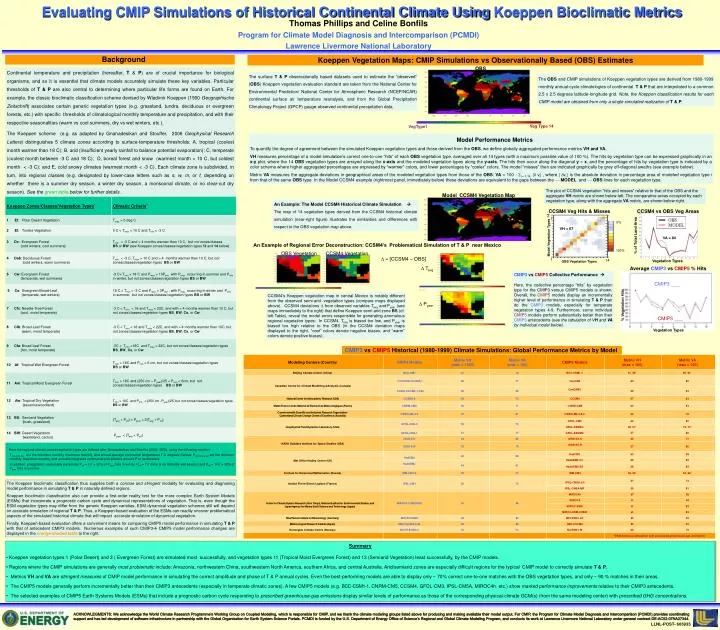
Evaluating CMIP Simulations of Historical Continental Climate Using Koeppen Bioclimatic Metrics Thomas Phillips and Celine Bonfils Program for Climate Model Diagnosis and Intercomparison (PCMDI) Lawrence Livermore National Laboratory ____________________________________________________________________________________________________________________________________________________________________ Background Koeppen Vegetation Maps: CMIP Simulations vs Observationally Based (OBS) Estimates Continental temperature and precipitation (hereafter, T & P) are of crucial importance for biological organisms, and so it is essential that climate models accurately simulate these key variables. Particular thresholds of T & P are also central to determining where particular life forms are found on Earth. For example, the classic bioclimatic classification scheme devised by WladimirKoeppen (1900 GeographischeZeitschrift) associates certain generic vegetation types (e.g. grassland, tundra, deciduous or evergreen forests, etc.) with specific thresholds of climatological monthly temperature and precipitation, and with their respective seasonalities (warm vs cool summers, dry vs wet winters, etc.). The Koeppen scheme (e.g. as adapted by Gnanadesikan and Stouffer, 2006 Geophysical Research Letters) distinguishes 5 climate zones according to surface-temperature thresholds: A, tropical (coolest month warmer than 18 C); B, arid (insufficient yearly rainfall to balance potential evaporation); C, temperate (coolest month between -3 C and 18 C); D, boreal forest and snow (warmest month > 10 C, but coldest month < -3 C); and E, cold snowy climates (warmest month < -3 C). Each climate zone is subdivided, in turn, into regional classes (e.g. designated by lower-case letters such as s, w, m, or f, depending on whether there is a summer dry season, a winter dry season, a monsoonal climate, or no clear-cut dry season). See the green table below for further details. The surface T & P observationally based datasets used to estimate the “observed” (OBS) Koeppen vegetation evaluation standard are taken from the National Center for Environmental Prediction/ National Center for Atmospheric Research (NCEP/NCAR) continental surface air temperature reanalysis, and from the Global Precipitation Climatology Project (GPCP) gauge-observed continental precipitation data. The OBS and CMIP simulations of Koeppen vegetation types are derived from 1980-1999 monthly annual-cycle climatologies of continental T & P that are interpolated to a common 2.5 x 2.5 degrees latitude-longitude grid. Note, the Koeppen classification results for each CMIP model are obtained from only a single simulated realization of T & P. OBS Model Performance Metrics To quantify the degree of agreement between the simulated Koeppen vegetation types and those derived from the OBS, we define globally aggregated performance metrics VH and VA. VH measures percentage of a model simulation’s correct one-to-one “hits” of each OBS vegetation type, averaged over all 14 types (with a maximum possible value of 100 %). The hits by vegetation type can be expressed graphically in an x-y plot, where the 14 OBS vegetation types are arrayed along the x-axis and the modeled vegetation types along the y-axis. The hits then occur along the diagonal y = x, and the percentage of hits by vegetation type is indicated by a color scheme where higher aggregated percentages are expressed by “warmer” colors, and lower percentages by “cooler” colors. The model “misses” then are indicated graphically by grey off-diagonal swaths (see example below). Metric VA measures the aggregate deviations in geographical areas of the modeled vegetation types from those of the OBS: VA = 100 - Si = 1,14 |d vi| , where | dvi | is the absolute deviation in percentage areaof modeled vegetation type i from that of the same OBS type. In the Model CCSM4 example (rightmost panel, immediately below) these deviations are equivalent to the gaps between the ___ MODEL and ___ OBS lines for each vegetation type. Veg Type 14 VegType1 The plot of CCSM4 vegetation “hits and misses” relative to that of the OBS and the aggregate VH metric are shown below-left. The comparative areas occupied by each vegetation type, along with the aggregate VA metric, are shown below-right. An Example: The Model CCSM4 Historical Climate Simulation The map of 14 vegetation types derived from the CCSM4 historical climate simulation (near-right figure) illustrates the similarities and differences with respect to the OBS vegetation map above. VA = 84 An Example of Regional Error Deconstruction: CCSM4’s Problematical Simulation of T & P near Mexico Model CCSM4 Vegetation Map CMIP3vsCMIP5 Collective Performance Here, the collective percentage “hits” by vegetation type for the CMIP3 versus CMIP5 models is shown. Overall, the CMIP5 models display an incrementally higher level of performance in simulating T & P than do the CMIP3 models, especially for temperate vegetation types 4-9. Furthermore, some individual CMIP5 models perform substantially better than their CMIP3 antecedents (see the tabulation of VH and VA by individual model below). CCSM4 Veg Hits & Misses CCSM4 vs OBS Veg Areas 14 CCSM4’s Koeppen vegetation map in central Mexico is notably different from the observed semi-arid .vegetation types (compare maps displayed above). CCSM4 deviations D from observed variables TavgandPyear (see maps immediately to the right) that define Koeppen semi-arid zone BS (cf. left Table), reveal the model errors responsible for generating anomalous regional vegetation types: In CCSM4, Tavg is biased too low, and Pyear is biased too high relative to the OBS (in the CCSM4 deviation maps displayed to the right, “cool” colors denote negative biases, and “warm” colors denote positive biases). % of Total Land Area Model Vegetation Types 0% VH = 67 VA = 84 100% D = [CCSM4 – OBS] CMIP3vsCMIP5 Historical (1980-1999) Climate Simulations: Global Performance Metrics by Model 1 14 OBS Vegetation Types DTavg Vegetation Types Average CMIP3vs CMIP5 %Hits OBS Vegetation CCSM4 Vegetation CMIP3 ___ DPyear % Vegetation Hits CMIP5 ___ Vegetation Types The Koeppen bioclimatic classification thus supplies both a concise and stringent modality forevaluating and diagnosing model performance in simulating T & P in naturally defined regions. Koeppen bioclimatic classification also can provide a first-order reality test for the more complex Earth System Models (ESMs) that incorporate a prognostic carbon cycle and dynamical representations of vegetation. That is, even though the ESM vegetation types may differ from the generic Koeppen varieties, ESM dynamical vegetation schemes still will depend on accurate simulation of regional T & P. Thus, a Koeppen-based evaluation of the ESMs can readily uncover problematical aspects of the simulated historical climate that will impact accurate simulation of dynamical vegetation. Finally, Koeppen-based evaluation offers a convenient means for comparing CMIP5 model performance in simulating T & P with that of antecedent CMIP3 models. Numerous examples of such CMIP3 CMIP5 model performance changes are displayed in the orange-shaded table to the right. • Summary • Koeppen vegetation types 1 (Polar Desert) and 3 ( Evergreen Forest) are simulated most successfully, and vegetation types 11 (Tropical Moist Evergreen Forest) and 13 (Semiarid Vegetation) least successfully, by the CMIP models. • Regions where the CMIP simulations are generally most problematic include: Amazonia, northwestern China, southwestern North America, southern Africa, and central Australia. Arid/semiarid zones are especially difficult regions for the typical CMIP model to correctly simulate T & P. • Metrics VH and VA are stringent measures of CMIP model performance in simulating the correct amplitude and phase of T & P annual cycles. Even the best-performing models are able to display only ~ 70% correct one-to-one matches with the OBS vegetation types, and only ~ 90 % matches in their areas. • The CMIP5 models generally perform incrementally better than their CMIP3 antecedents (especially in temperate climatic zones). A few CMIP5 models (e.g. BCC-CSM1-1, CNRM-CM5, CCSM4, GFDL-CM3, IPSL-CM5A, MIROC4h, etc.) show marked performance improvements relative to their CMIP3 antecedents. • The selected examples of CMIP5 Earth Systems Models (ESMs) that include a prognostic carbon cycle responding to prescribed greenhouse-gas emissions display similar levels of performance as those of the corresponding physical-climate GCM(s) (from the same modeling center) with prescribed GHG concentrations. ____________________________________________________________________________________________________________________________________________________________________ ACKNOWLEGMENTS: We acknowledge the World Climate Research Programme’s Working Group on Coupled Modeling, which is responsible for CMIP, and we thank the climate modeling groups listed above for producing and making available their model output. For CMIP, the Program for Climate Model Diagnosis and Intercomparison (PCMDI) provides coordinating support and has led development of software infrastructure in partnership with the Global Organization for Earth System Science Portals. PCMDI is funded by the U.S. Department of Energy Office of Science’s Regional and Global Climate Modeling Program, and conducts its work at Lawrence Livermore National Laboratory under general contract DE-AC52-07NA27344. LLNL-POST- 605935