Download
1 / 22
220 likes | 342 Views
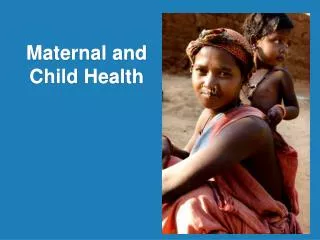
Maternal and Child Health 2000-2009, Georgia . Nata Kazakhashvili, MD PHD Ivane Javakhishvili Tbilisi State University. Key Points. Factors Affecting Mothers and Children's Health. War and conflicts

E N D
Maternal and Child Health 2000-2009, Georgia Nata Kazakhashvili, MD PHD IvaneJavakhishvili Tbilisi State University
Key Points Factors Affecting Mothers and Children's Health • War and conflicts • Ethnic diversity of the Caucasian region (legal, cultural and religious obstacles to use reproductive health services) • Migration and Disruptions of traditional family life • Poverty and unemployment
National environment and ethnic diversity of the Caucasian region Source: http://titus.uni-frankfurt.de/didact/karten/kauk/kaukasm.htm
https://www.cia.gov/library/publications/the-world-factbook/geos/am.htmlhttps://www.cia.gov/library/publications/the-world-factbook/geos/am.html http://en.wikipedia.org/wiki/List_of_countries_by_infant_mortality_rate http://www.geostat.ge/index.php?action=page&p_id=145&lang=geo http://www.indexmundi.com/azerbaijan/infant_mortality_rate.html
Unemployment rate (%)source: http://www.indexmundi.com/g/g.aspx?v=74&c=gg&l=en
Population below poverty line Source: Ministry of Labour, Health and Social Affairs of Georgia.
Number of children under 14 and the number of older adults over 65 Georgia, 1995-2009 Source: www.geostat.ge
% of population aged 65+ years Source: WHO/Europe, European HFA Database, July 2010
Totalfertilityrate Source: WHO/Europe, European HFA Database, July 2010
Home Deliveries (%)2003 – 3,8%; 2004 – 2,5%; 2005 – 1,5%; 2006 – 1,2%; 2007 – 0,6%; 2008 – 0,4% 2009 – 0,3%2010 - 0.4% Number of Births. Georgia, 1986-2009 Source: www.ncdc.ge
Numberoflivebirthstomothersage<20 and >35 years Source: www.ncdc.ge www.geostat.ge
percent of physiological and pathological deliveries in total number of deliveries.2005-2010 Source: www.ncdc.ge
Caesareansections rate per 1000 live births (Georgia, EU, CIS) 2000-2010 Georgia EU CIS
Perinatal Mortality Rate per 1000 births Georgia, EU, CIS. 2000-2010 Georgia EU CIS
Stillbirth Rate per 1000 births Georgia, EU, CIS. 2000-2010 Georgia EU CIS
Early Neonatal Mortality Rate per 1000 live-birth and Newborn Patient Referrals (percent) 2005-2010 Early Neonatal Mortality Referrals
Poverty Rate, Birth rate and Perinatal Mortality Rate by region, Georgia 2002 source: IMPROVING TARGETING OF POOR AND EXTREMELY POOR FAMILIES IN GEORGIA: THE CONSTRUCTION OF POVERTY MAPS AT THE DISTRICT LEVELGeorgia 2003 UNDP Country Office in Georgia www.ncdc.ge
Poverty Rate, Birth rate and stillbirth by region, Georgia 2000
Secondary sex ratio, Georgia, 2000 – 2010 M/F Georgia Normal