Download
1 / 22
220 likes | 314 Views
All About a Bounce Act 2: Quadratics. A Kern High School District Task. Warm-up. In the graph given, what is the same and what is different?. Warm-up. Draw a vertical line down the middle. How are the x-coordinates related to the line?. Warm-up.

E N D
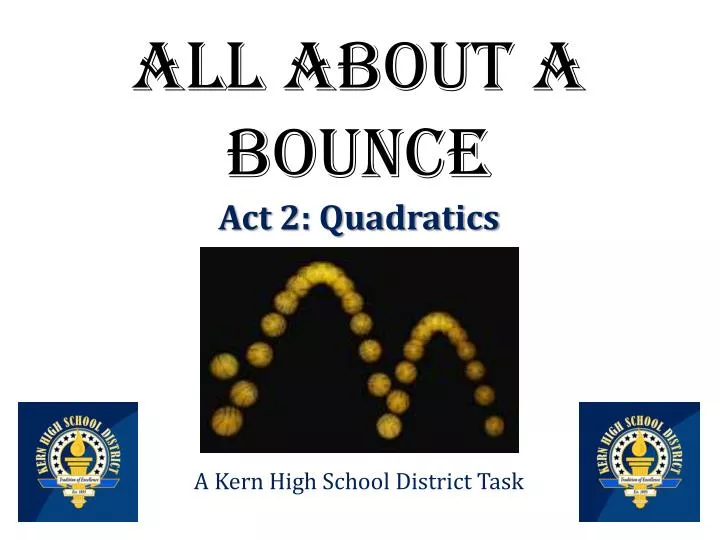
All About a BounceAct 2: Quadratics A Kern High School District Task
Warm-up In the graph given, what is the same and what is different?
Warm-up Draw a vertical line down the middle. How are the x-coordinates related to the line?
Warm-up Find the coordinates of the points that are symmetrical to the given points.
The 8th period’s ball bounce data is missing! All but two post-it notes fell off of the wall and were swept up by the custodian. The points still on the board are (2, 6.1) and (6, 6.1). Can you help me get back the data we are missing?
I. Plot the points. Construct a graph through the given points and write an equation for 8th period’s ball bounce.
a. Explain the process you used to graph and write the equation that went through the two points.
b. What is the maximum height the ball traveled? How did you arrive at your answer?
c. Where did the ball hit the ground? How did you arrive at your answer? Compare your answers for a, b, and c with a partner around you.
II. I found my notes for 8th period’s data! DATA - 8th Period
b. How does your maximum compare with the one from 8th period?
III. Two points are enough to construct a line. Why aren’t they enough to construct 8th period’s parabola?
IV. Each group will be given the vertex and their own data point from 8th period’s ball bounce.
a. Vertex(4, 8.5) Point of the parabola_________.
b. Write the equation and make a graphical model of the ball’s flight.
c. Compare your equations and graphs with other groups. If we have the vertex, does it matter what other point on the parabola we choose?
Extension • Why do we need the vertex and another point on the parabola? Why couldn’t we graph 8th period’s parabola with just the vertex?