Download
1 / 16
160 likes | 256 Views
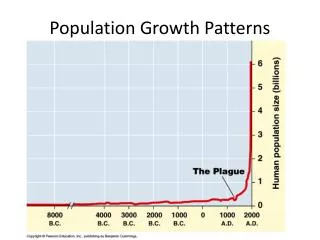
Patterns of Care in a Washington Dental Service Population. Michael A. del Aguila Paul B. Robertson Maxwell H. Anderson Denise L. Porterfield. Purpose. Insured population Treatment patterns Change over time Practice characteristics Treatment costs. WDS - Background.

E N D
Patterns of Care in a Washington Dental Service Population Michael A. del Aguila Paul B. Robertson Maxwell H. Anderson Denise L. Porterfield
Purpose • Insured population • Treatment patterns • Change over time • Practice characteristics • Treatment costs
WDS - Background • 33% of WA dental insurance market • 1.5 million covered lives • 90% of all dentists • Claims-based data warehouse • 1993 to present day • 10 million records per year
Methods • Two time periods : 1993 & 1999 • WA treatment only • Number and type of patient • Number and type of providers • ADA treatment categories • Adjustment for 1999 $$
Data Validation • Convenience sample – 8 dental offices • 1 Pediatric Dentist • 1 Periodontist • 6 General Dentists • Random sample all claims (n=200) • Random sample extractions (n=200) • Trained abstractor • Percent agreement – DW with chart
Data ValidationExamination and Prevention FACTOR DW Chart Agree (%) Examinations 126 122 96.8 Radiographs 110 102 92.7 Cleaning, Hyg. 100 98 98.0 & Prevention Fluoride & Seal. 55 54 98.2
Data ValidationRestorative Care FACTOR DW Chart Agree (%) Amalgams 38 38 100.0 Composites 42 41 97.6 Inlays 1 1 100.0 Single Crowns 16 16 100.0 Endodontics 4 4 100.0
Data ValidationPeriodontal Care ITEM DW Chart Agree (%) ScRP & Perio M. 19 18 94.7 Perio Surgery 19 18 94.7
Data ValidationExtraction and Other ITEM DW Chart Agree (%) Extractions 329 327 99.4 & Impaction Emergencies 12 6 50.0 Anesth./Sedation 1 1 100.0 Other Care 14 12 85.7
Results - EpidemiologyWDS 1993 and 1999 1993 1999 Patients 620,293 880,317 Female 56% 55% Primary 45% 47% Dependent 33% 31% Dentists 2,956 3,402 Female 8.7% 11.2% Gen. Practice 84.6% 82.3% Treatments4,321,256 5,782,729 Costs*$306,520,490 $511,084,696 *Adjusted for 1999 $$
Results - EpidemiologyWDS 1993 and 1999 1993 1999 %Change Patients/Dentist 210 259 23 Treatments/Dentist 1462 1700 16 Treatment/Patient 6.97 6.57 -6 Cost/Patient* $494 $581 17 * Adjusted for 1999 $$
UTILIZATION BY AGE POPULATION BY AGE
Procedures & Costs - PercentsTreatment Category Procedures Cost Category 1993 1999 1993 1999 Exam, dx, prev 67% 66% 30% 30% Caries treatment 17% 18% 41% 42% Perio treatment 5% 5% 7% 6% Prosthodontics 1% 1% 7% 6% Orthodontics 2% 2% 7% 6% Oral surg. & other 9% 9% 9% 10%
Treatment Costs by Age - 1993 Patient Age
Treatment Costs by Age - 1999 Patient Age
Conclusions • Data are valid • Treatment patterns largely unchanged • no decline in caries tx • Increase: patients per dentist, procedures per dentist, cost per patient • Decrease: procedures per patient • Changes in coverage will be reflected in claims data treatment patterns