Download
1 / 43
430 likes | 537 Views
Evaluation of Ozone Concentrations at Residence Layer in the Southern Taiwan by CMAQ. Yee-Lin Wu 1 , Long-Yuan Yang 1 , Chi-Ho Lin 2 , Gi-Shan Lai 2 , and Shin-Chu Lai 3 1 Department of Environmental Engineering, National Cheng Kung University

E N D
Evaluation of Ozone Concentrations at Residence Layer in the Southern Taiwan by CMAQ Yee-Lin Wu1, Long-Yuan Yang1, Chi-Ho Lin2, Gi-Shan Lai2, and Shin-Chu Lai3 1Department of Environmental Engineering, National Cheng Kung University 2Department of Environmental Engineering, Fi-Yi University of Technology 3Center of General Education, Chi-Long University
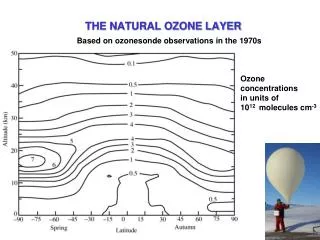
Introduction • High ozone concentrations in southern Taiwan • High ozone concentrations at 600 to 1000 m prevailing from evening to the early morning in the following day
Wind Wind Inversion layer Noon Early Morning city Subsidence Evening Afternoon Possible mechanisms for the formation of residence layer in southern Taiwan residual layer residual layer
Purposes of This Study • To simulate the high ozone concentrations at ground layer. • To simulate the ozone residence layer in southern Taiwan.
Meteorological System MM5 v2; Blackadar mechanism; MCIP-2 • Emission System TEDS5.1; SMOKE; BEIS3 • CMAQ CB-IV; K-theory diffusivity
Emission inventory for PM10、SOx、NOx、VOC and CO in southern Taiwan. The percentage is for the fraction of Taiwan. (TEDS5.1)unit: ton
Comparisons between simulated and observed ozone concentrations for spatial distribution
Comparisons between simulated and observed ozone concentrations for spatial distribution
Comparisons between simulated and observed ozone concentrations for spatial distribution
Comparisons between simulated and observed ozone concentrations for spatial distribution
Comparisons between simulated and observed ozone concentrations for spatial distribution
Comparisons between simulated and observed NOx concentrations for temporal variations
Comparisons between simulated and observed NOx concentrations for temporal variations
Comparisons between simulated and observed NOx concentrations for temporal variations
Comparisons between simulated and observed ozone concentrations for temporal variations
Comparisons between simulated and observed ozone concentrations for temporal variations
Comparisons between simulated and observed ozone concentrations for temporal variations
Normalized error for unpair peak • Normalized error for pair
Comparisons between simulated and observed HNO3 concentrations No heteorogeneous N2O5 hydrolysis Formation of HNO3
Comparisons between simulated and observed HNO2 concentrations Only NO+OH, NO+NO2 and NO2+NO2 reactions included in CMAQ; No heteorogeneous NO2 reaction for HONO formation.
Comparisons between simulated and observed H2O2 concentrations
Conclusions • The simulated and observed ground ozone concentrations were in good agreement. • The ozone residence layer in southern Taiwan was successfully simulated by CMAQ. • However, the concentrations for HNO3, HNO2, and H2O2 were underestimated by CMAQ, especially for HNO2
Acknowledgements • The project was supported by Taiwan National Science Council.
第四層模擬範圍 高雄測站 (22.5N, 120.3E) NCEP AVN vs MM5 Model Validation II
第四層模擬範圍 高雄測站 (22.5N, 120.3E) NCEP AVN vs MM5 Model Validation II
200 m 500m 1000m 第四層模擬範圍 06Z 15 Dec. 2004 Streamline
1500 m 2000m 3000m 第四層模擬範圍 06Z 15 Dec. 2004 Streamline
200 m 500m 1000m 第四層模擬範圍 06Z Dec. 2004 Streamline