Download
1 / 10
100 likes | 363 Views
Average Customer Purchase Sorted By MTO Never, Ever, Usually.

E N D
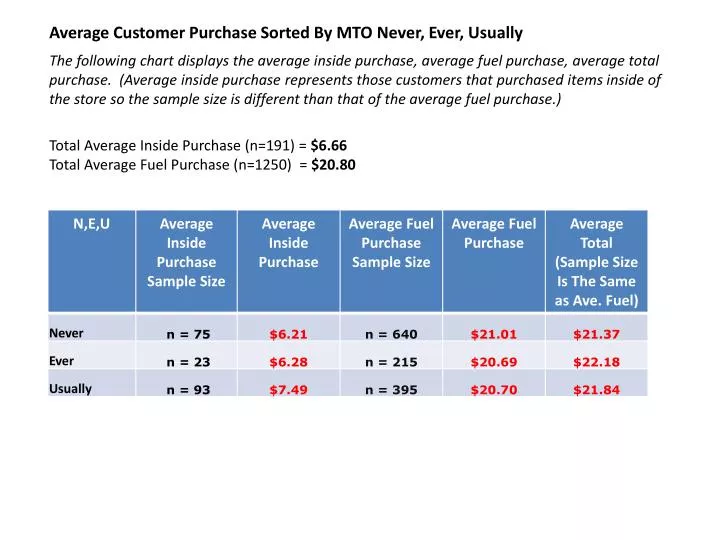
Average Customer Purchase Sorted By MTO Never, Ever, Usually The following chart displays the average inside purchase, average fuel purchase, average total purchase. (Average inside purchase represents those customers that purchased items inside of the store so the sample size is different than that of the average fuel purchase.) Total Average Inside Purchase (n=191) = $6.66 Total Average Fuel Purchase (n=1250) = $20.80
Customer Sales Contribution Sorted By MTO Never, Ever, Usually Customers that USUALLY buy MTOs have the highest average weekly sales contribution BUT customers that NEVER buy MTOs have the highest total weekly sales contribution. There is a larger group of customers that NEVER buy MTOs, this could be why this group possesses the highest percent of total weekly sales contribution. *To calculate the weekly total sales contribution, the actual purchase made by the customers interviewed are multiplied by the frequency rate at which they visit Sheetz. After weighting these specific purchases we are able to see weekly contribution that these groups possess.
Average Customer Purchase Sorted By Store Location The following chart displays the average inside purchase, average fuel purchase, and average total purchase of a Sheetz customer. (Average inside purchase represents those customers that purchased items inside of the store so the sample size is different than that of the average fuel purchase for all stores.) *Winston-Salem (#385) and Greenville (#397) stores did not have enough sample data to be included in this particular study.
Overall Gas Only, Gas & Non-Food Items, And Gas & Food Purchases The following chart displays the percentage of Sheetz customers that USUALLY buy Gas Only, Gas & Non-Food Items, and Gas & Food. n = 1250
Gas Only, Gas & Non-Food Items, And Gas & Food Purchases Based On Store Location The following chart displays the percentage of Sheetz customers that USUALLY buy Gas Only, Gas & Non-Food Items, and Gas & Food based on store locations. *Winston-Salem (#385) and Greenville (#397) stores did not have enough sample data to be included in this particular study.
Gas Only, Gas & Non-Food Items, And Gas & Food Purchases Based On Region The following chart displays the percentage of Sheetz customers that USUALLY buy Gas Only, Gas & Non-Food Items, and Gas & Food based on store regions.
Average Customer Purchase Sorted By Customer Frequency The following chart displays the average inside purchase, average fuel purchase, and average total purchase of a Sheetz customer. (Average inside purchase represents those customers that purchased items inside of the store so the sample size is different than that of the average fuel purchase for all stores.)
Customer Sales Contribution Sorted By Customer Frequency Customers that frequent Sheetz more than twice a week possess the highest percent of weekly sales contribution along with the highest weekly average sales contribution. *To calculate the weekly total sales contribution, the actual purchase made by the customers interviewed are multiplied by the frequency rate at which they visit Sheetz. After weighting these specific purchases we are able to see the weekly contribution that these groups possess.
Average Customer Purchase Sorted By Sheetz Ever & Usually The following chart displays the average inside purchase, average fuel purchase, average total purchase. (Average inside purchase represents those customers that purchased items inside of the store so the sample size is different than that of the average fuel purchase.) Total Average Inside Purchase (n=202) = $6.08 Total Average Fuel Purchase (n=1250) = $20.80
Customer Sales Contribution Sorted By Sheetz Ever & Usually Customers that USUALLY visit Sheetz on a regular basis possessthe highest percent of sales contribution. *To calculate the weekly total sales contribution, the actual purchase made by the customers interviewed are multiplied by the frequency rate at which they visit Sheetz. After weighting these specific purchases we are able to see weekly contribution that these groups possess.