Download
1 / 18
180 likes | 277 Views
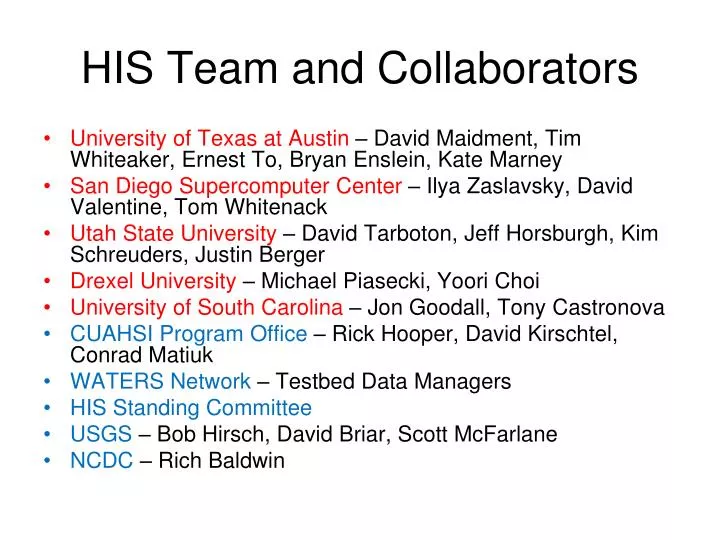
HIS Team and Collaborators. University of Texas at Austin – David Maidment, Tim Whiteaker, Ernest To, Bryan Enslein, Kate Marney San Diego Supercomputer Center – Ilya Zaslavsky, David Valentine, Tom Whitenack

E N D
HIS Team and Collaborators • University of Texas at Austin – David Maidment, Tim Whiteaker, Ernest To, Bryan Enslein, Kate Marney • San Diego Supercomputer Center – Ilya Zaslavsky, David Valentine, Tom Whitenack • Utah State University – David Tarboton, Jeff Horsburgh, Kim Schreuders, Justin Berger • Drexel University – Michael Piasecki, Yoori Choi • University of South Carolina – Jon Goodall, Tony Castronova • CUAHSI Program Office – Rick Hooper, David Kirschtel, Conrad Matiuk • WATERS Network – Testbed Data Managers • HIS Standing Committee • USGS– Bob Hirsch, David Briar, Scott McFarlane • NCDC– Rich Baldwin
The Need: Hydrologic Information Science It is as important to represent hydrologic environments precisely with data as it is to represent hydrologic processes with equations Physical laws and principles (Mass, momentum, energy, chemistry) Hydrologic Process Science (Equations, simulation models, prediction) Hydrologic conditions (Fluxes, flows, concentrations) Hydrologic Information Science (Observations, data models, visualization Hydrologic environment (Dynamic earth)
Advancement of water science is critically dependent on integration of waterinformation Databases: Structured data sets to facilitate data integrity and effective sharing and analysis. - Standards - Metadata - Unambiguous interpretation Analysis: Tools to provide windows into the database to support visualization, queries, analysis, and data driven discovery. Models: Numerical implementations of hydrologic theory to integrate process understanding, test hypotheses and provide hydrologic forecasts. Models ODM Web Services Databases Analysis
What is the CUAHSI HIS? 3rd-Party Analysis Software Data Access Toolbox (with web service capability) Browser-based Data Discovery Tools GIS Matlab Splus R IDL HydroExcel HydroGet OpemMI Interface HydroObjects Java C++ VB DASH Hydroseek 3rd-Party Data Servers CUAHSI-HIS Servers CUAHSI-HIS Central Servers USGS NWIS NCDC ASOS NCEP NAM 12K NASA MODIS etc. ODM Database WaterOneFlow Web Services DASH ODM Data Loader ODM SDL ODM Tools ODM Database WaterOneFlow Web Services Network/WSDL Registry HydroSeek HydroTagger 3rd-Party Metadata Repositry etc. Data Transmission Formats WaterML An internet based system to support the sharing of hydrologic data comprising databases connected using the internet through web services as well as software for data discovery, access and publication. Other
Key HIS components HydroSeek Clients Matlab HydroGet HydroExcel ODM Ontology • WSDL Registry • http://cbe.cae.drexel.edu/wateroneflow/CIMS.asmx?WSDL • http://ccbay.tamucc.edu/CCBayODWS/cuahsi_1_0.asmx?WSDL • http://ees-his06.ad.ufl.edu/santafe-srgwl/cuahsi_1_0.asmx?WSDL • http://ferry.ims.unc.edu/modmon/cuahsi_1_0.asmx?WSDL • http://his02.usu.edu/littlebearriver/cuahsi_1_0.asmx?WSDL CV Services ODM Tools
Base Station Computer(s) Telemetry Network Sensors CUAHSI HIS Data Publication System Query, Visualize, and Edit data using ODM Tools Discovery Analysis Access Hydroseek GIS Matlab Splus R IDL HydroExcel HydroGet HydroLink HydroObjects Java C++ VB ODM Database Service Registry Hydrotagger GetSites GetSiteInfo GetVariableInfo GetValues Streaming Data Loader Harvester WaterML WaterOneFlow Web Service ODM Data Loader Water Metadata Catalog ODM Excel Text ODM Contribute your ODM HIS Central http://his.cuahsi.org
Direct analysis from your favorite analysis environment. e.g. Matlab % create NWIS Class and an instance of the class createClassFromWsdl('http://river.sdsc.edu/wateroneflow/NWIS/DailyValues.asmx?WSDL'); WS = WaterOneFlow; % GetValues to get the data siteid='NWIS:02087500'; bdate='2002-09-30T00:00:00'; edate='2006-10-16T00:00:00'; variable='NWIS:00060'; valuesxml=GetValues(WS,siteid,variable,bdate,edate,'');
“When” Time, T t A data value vi (s,t) “Where” s Space, S Vi “What” Variables, V CUAHSI Observations Data Model Groundwater levels Streamflow • A relational database at the single observation level (atomic model) • Stores observation data made at points • Metadata for unambiguous interpretation • Traceable heritage from raw measurements to usable information • Standard format for data sharing • Cross dimension retrieval and analysis Precipitation & Climate Soil moisture data Flux tower data Water Quality
CUAHSI Observations Data Model http://his.cuahsi.org/odmdatabases.html Horsburgh, J. S., D. G. Tarboton, D. R. Maidment and I. Zaslavsky, (2008), A Relational Model for Environmental and Water Resources Data, Water Resour. Res., 44: W05406, doi:10.1029/2007WR006392.
Daily Average Discharge ExampleDaily Average Discharge Derived from 15 Minute Discharge Data
HIS Implementation in WATERS Network Information System National Hydrologic Information Server San Diego Supercomputer Center • 11 WATERS Network test bed projects • 16 ODM instances (some test beds have more than one ODM instance) • Data from 1246 sites, of these, 167 sites are operated by WATERS investigators
HIS Desktop (to be developed in 2009)Harvesting data from web services Observations GIS Models Climate Remote Sensing HIS Desktop can be rebranded to become CZO Desktop if necessary
Critical Zone Observatory Data Discovery • Each CZO maintains its own data management system(s) using the data formats it prefers • The three CZO’s have a common metadata management system, expressed in tables, where each table record describes a particular data series or dataset, including its URL address • CZO Metadata tables are published and accessed through the internet using Web Feature Services (WFS) defined by the Open Geospatial Consortium • Metadata table records are linked to geographic features, also published as Web Feature Services to show data location on a base map
CZO Data Types • Regular Time Series – data measured with automated sensors at a fixed location at regular intervals • Irregular Time Series – manually collected field samples from a fixed location at irregular intervals • GIScoverages and photos • One-Time Collections – rock and soil samples collected once at known position and depth • Other Data – LIDAR, land surveys, channel cross-sections, tree surveys, geophysics, snow surveys Point Observations Time Series
Observations Catalog for Waters Network Testbed Project in Corpus Christi Bay http://129.116.104.172/ArcGIS/services/CCBAY_MySelect/GeoDataServer/WFSServer displayed over the US Hydrology Base Map from http://downloads2.esri.com/resources/arcgisdesktop/maps/us_hydrology.mxd The same metadata structure supports data access through WaterML WSDL address and parameters to obtain observations data using GetValues Metadata for selected data series at observation point H1
Summary • Generic method for publishing observational data • Supports many types of point observational data • ODM and WaterML Overcome syntactic and semantic heterogeneity using a standard data model and controlled vocabularies • Supports a national network of observatory test beds but can grow! • Web services provide programmatic machine access to data • Work with the data in your data analysis software of choice • Internet-based applications provide user interfaces for the data and geographic context for monitoring sites