Download
1 / 37
370 likes | 376 Views
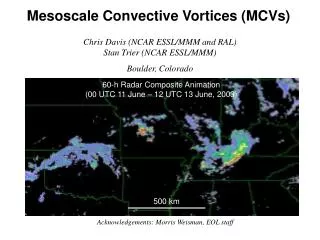
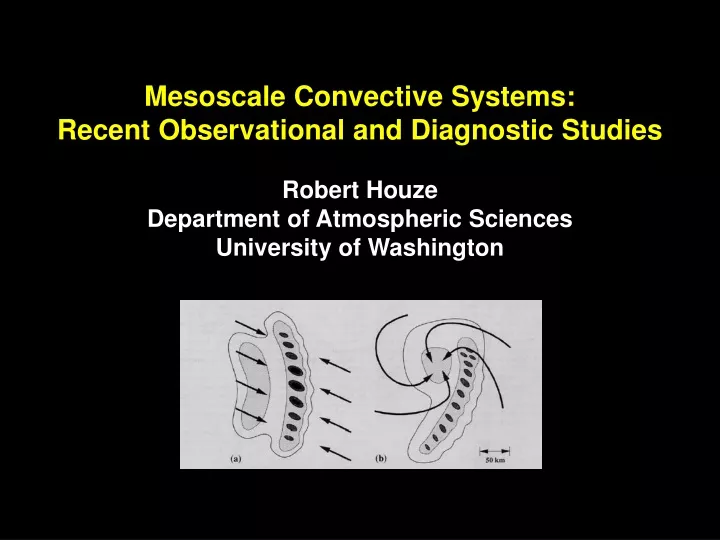
Mesoscale Convective Systems: Recent Observational and Diagnostic Studies Robert Houze Department of Atmospheric Sciences University of Washington. DEFINITION Mesoscale Convective System (MCS)

E N D
Mesoscale Convective Systems: Recent Observational and Diagnostic Studies Robert Houze Department of Atmospheric Sciences University of Washington
DEFINITION Mesoscale Convective System (MCS) A cumulonimbus cloud system that produces a contiguousprecipitationarea ~100 km or more in at least one direction
Questions • Why do tropical and midlatitude MCSs look different? • Does layer lifting occur in a mature MCS? • Is rear inflow really from the rear? • What controls the size of MCSs? • What controls the movement of MCSs?
Why do tropical and midlatitude MCSs look different?
Radarreflectivity Strat. Conv. Houze et al. 1989, 1990 Tropical & midlatitudes “Symmetric” Midlatitudes(later stages) “Asymmetric”
MCV Skamarock et al. 94 No Coriolis Coriolis Symmetric Asymmetric (Tropics & midlatitudes) (Midlatitudes)
CrossoverZone Parcel viewpointZipser 1977
MAUL Layer viewpoint: Bryan and Fritsch 2000 “Slab” or Layer Overturning
Note! 0.5-4.5 km Layer viewpoint: Kingsmill & Houze 1999 TOGA COARE Airborne Doppler Observations of MCSs Convective region flights
Layer viewpoint: Mechem, Houze, & Chen 2002 14 TOGA COARE 23 Dec 92 12 10 150 8 Z (km) 6 100 Y (km) 4 50 2 0 150 200 250 150 200 250 X (km) X (km)
A A B B Moncrieff & Klinker 1997 plan view 1000 km 1000 km cross section
Diversity of stratiform structure: Parker & Johnson 2000 PATTERNS OFEVOLUTION OF STRATIFORM PRECIPITATION IN MIDLATITUDESQUALL LINES
Kingsmill & Houze 1999Documented airflow shown by airborne Doppler inTOGA COARE MCSs Stratiform region flights 0°C
JASMINE: Ship radar, Bay of Bengal, 22 May 1999 Refl. Reflectivity1.5 km level 100 km Horizontal Distance (km) RadialVelocity Radial Velocity3.5 km level 11 Height (km) 0 0 192 11 Height (km) 0 0 192 Horizontal Distance (km) 90 km
JASMINE: Ship radar, Bay of Bengal, 22 May 1999 Refl. Reflectivity1.5 km level 100 km Horizontal Distance (km) RadialVelocity Radial Velocity3.5 km level JASMINE: Ship radar, Bay of Bengal, 22 May 1999 12 Height (km) Reflectivity1.5 km level 0 0 192 100 km Horizontal Distance (km) Horizontal Distance (km) 12 Height (km) Radial Velocity3.5 km level 0 0 192 Horizontal Distance (km) 90 km
Factors determining the size of MCS ICAPE, sustainability, diurnal cycle
“Super Convective Systems”(SCS) Sizes of MCSs observed in TOGA COARE Chen et al. 1996
Examplesof TOGACOAREMCSs Satellite IR overlaid with A/C radar 100 km
Yuter & Houze 1998 CS map Convective echo % of grid Stratiform echo Satellite IR y (km) % of grid Mean IR temp (K) x (km)
Statistics for all TOGA COARE satellite/radar comparisons Yuter & Houze 1998 Percent of 24 km square grid covered by A/C radar echo in all the MCS
Statistics for all TOGA COARE satellite/radar comparisons Yuter & Houze 1998 Portion of 240 km scale grid covered by convective radar echo
Schumacher & Houze 2003 TRMM Precipitation radar:% of 2.5 deg grid covered by stratiform radar echo Annual Average
Factors determining the movement of MCS: Waves in the environment, cold pool dynamics
Nakazawa 1988 INTRASEASONALENSEMBLE VARIATION SUB-ENSEMBLE MESOSCALE CONVECTIVE SYSTEM
12 13 14 15 IN TOGA COAREMCSs moved individually with wave much of the time Chen, Houze,& Mapes 1996AnalyzedIR data3°N-10°S208°K threshold A/Cflightson 12-14Dec Time (day) Longitude
Serra & Houze 2002TEPPS—East Pacific ITCZ Ship radardata Easterly wave and cold pool propagation hard to distinguish
NOAA Ship R.H. Brown JASMINE: May 1999 40N equator 60E 100E
JASMINE IR sequence (courtesy P. Zuidema)
Ship track 5 10 15 20 25 30 May 1999 Webster et al. 2002 IR over Bay of Bengal during JASMINE
Mapes et al. (2002) West Coast of South Am. Gravity Wave hypothesis
Carbone et al. 2002 WSR88-Dradar dataover U.S.in time/longitudeformat
Conclusions • Coriolis effect explains why midlatitude MCSs exhibit asymmetry and develop MCVs as they evolve—and why tropical MCSs don’t have asymmetry • Parcel lifting gives way to layer lifting in mature MCSs when potentially unstable inflow air becomes moistened—circulations become mesoscale! • Midlevel inflow enters stratiform regions from various directions—controlled by environment shear • Max size of MCSs related to sustainability of low-level moist inflow—get biggest systems over oceans and with LLJs • MCSs motion may be determined by waves propagating through the environment—gravity waves, inertio-gravity waves,…